
Volume indicator
One of the easiest technical analysis indicators to understand is the Volumes indicator. It provides data of trading volume. It can be used to assess the degree of overbought/oversold assets. In the review, we consider the characteristics of the indicator, the principle of operation and how to use it in trading.
The guide has been prepared by the CScalp terminal team. You can get CScalp by leaving your e-mail in the form below.
Indicator characteristics
The Volumes indicator is used to analyze trading volume. With its help, you can evaluate the duration and stability of the trend and the liquidity level of the trading instrument. It is used in the analysis of both the stock and cryptocurrency markets.
A characteristic feature of the indicator is the absence of complex formulas. Essentially, the Volume indicator counts ticks over an n-timeframe. Each tick is part of a histogram that changes depending on the increasing or decreasing trading volume. Ticks appear after the close of the next candle on the chart.
Histogram bars are colored red or green depending on the color of the candle. If the price rises, the candlestick and indicator bar turn green. If the price falls it turns red.
Let’s make a couple examples of using the indicator on TradingView charts.
The BTC/USD daily chart shows bars of different sizes. Large corresponds to a large volume. These are the moments when sellers and buyers showed high interest in the asset. The small ones show the periods when interest in BTC/USD weakened.

How to Volume indicator in trading
As a rule, the Volume indicator is used in combination with other technical analysis indicators. Volume is displayed depending on the time of day and other factors. Therefore, in addition to the Volumes indicator, swing traders and medium-term traders use moving averages.
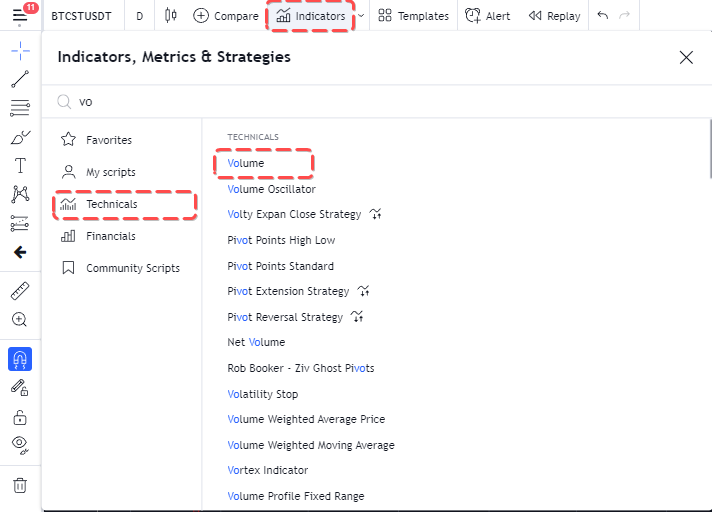
Indicator’s path in TradingView: “Indicators, Metrics and Strategies” – “Volume“.
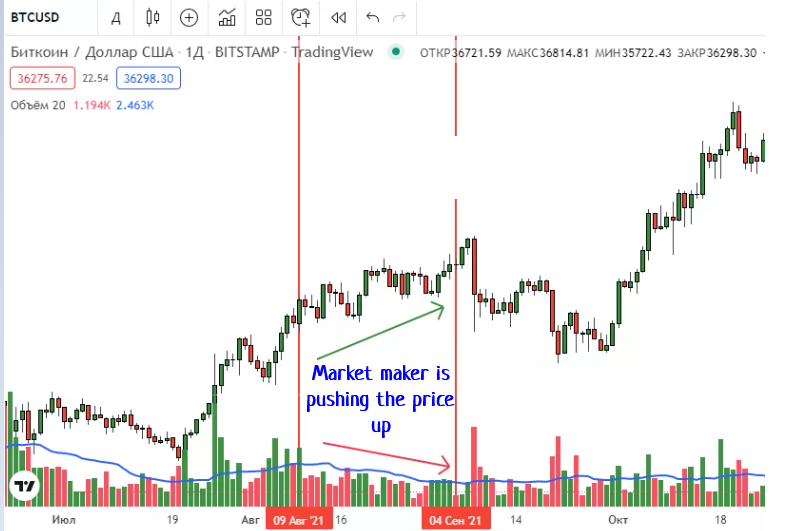
In the settings of the Volume trading indicator, in the “Style” tab, the “Volume MA” parameter is enabled: the moving average is superimposed on top of the volume indicator. The period of the moving average is set in the “Arguments” tab.
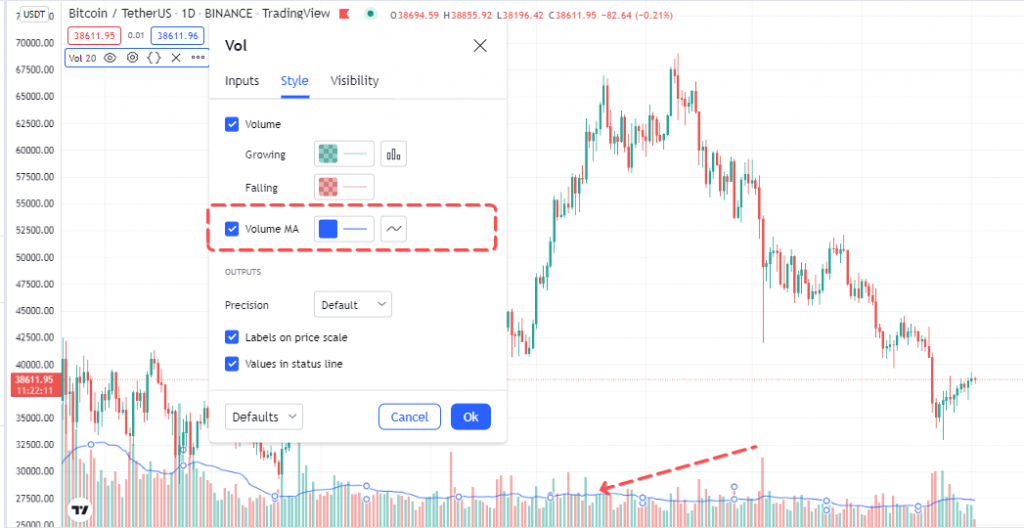
The moving average allows you to more accurately track the dynamics of volume changes while trading. Ticks on a chart with a filter in the form of a moving average help predict further price changes.
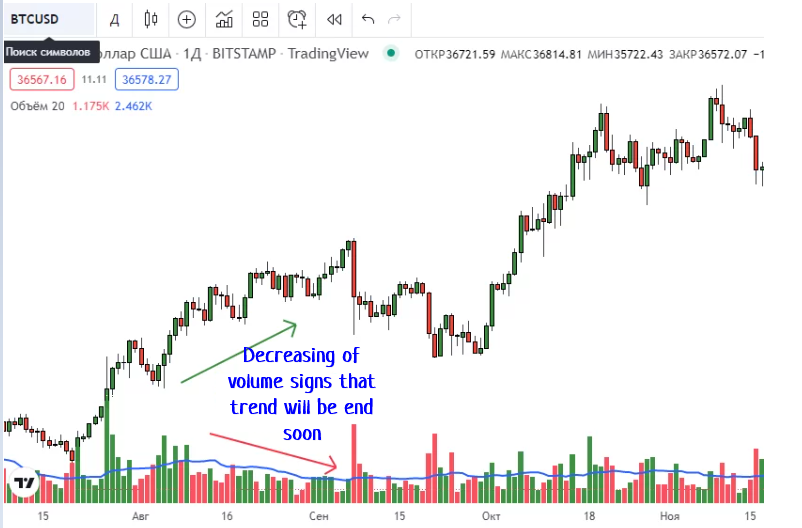
There is a volume decreasing against the backdrop of an uptrend. This indicates that it will end soon. And, indeed, further correction follows.
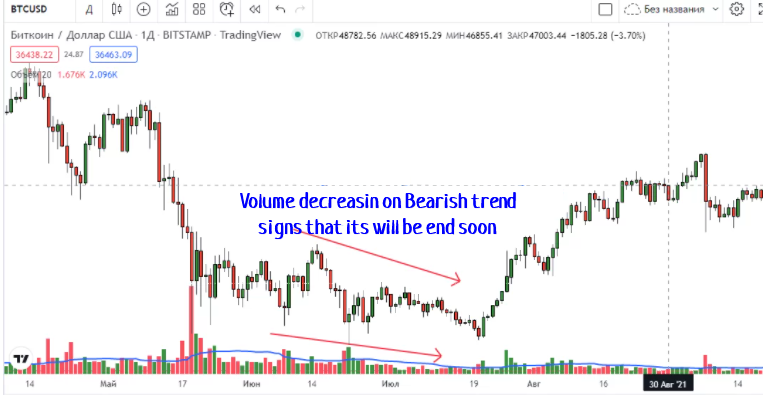
In the second case, trading volume decreases on a bearish trend. Here there is a forecast of an imminent trend change to an upward one, which happens in the future.
Indicator’s modification
There are many modifications of the volume indicator. Let’s consider one of them – Volume oscillator. On the chart, it displays the difference between two moving averages of trading volume.
Formula:
Vol Osc = Short length – Long legth,
Short length – fast moving average, Long length – slow moving average.
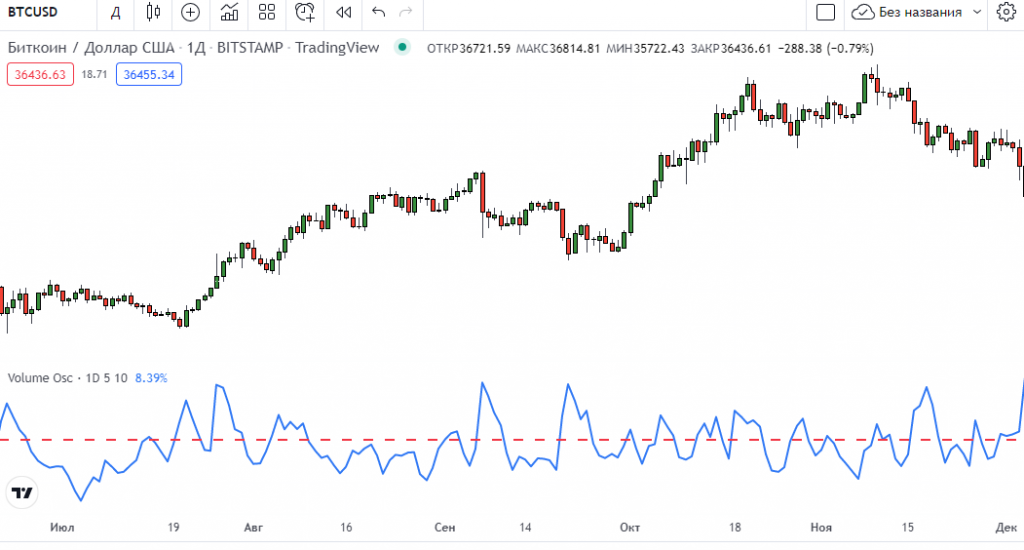
The task of the indicator is showing a stronger volume pattern. If it slides quickly above the slow one, the oscillator is above the zero area – the volume is growing. In the reverse situation, the oscillator is below zero. This means that the amount is on the short side.
By default, the Short Length is 5, and the Long Length is 10. It is desirable to increase the periods of moving averages, to increase the intensity of the amount of market noise.
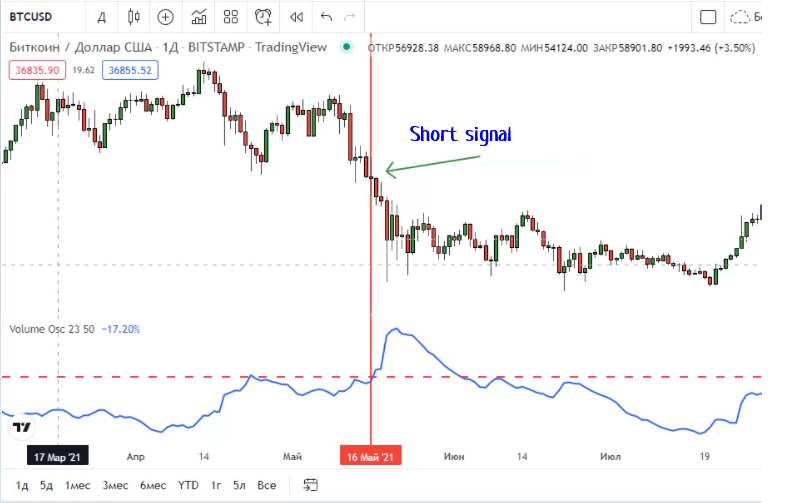
The crossing of the zero mark by the oscillator from the bottom up is considered as a signal. This is a convenient moment to enter a trend trade.
Conclusion
Trading volumes have a strong influence on price movement. For a trader to track trading volumes in order to understand a possible price change. To do this, swing traders and medium-term traders use the Volumes indicator. Intraday traders and scalpers use cluster analysis.
Join the CScalp Trading Community
Join our official trader's chat. Here you can communicate with other scalpers, find trading soulmates and discuss the market. We also have an exclusive chat for crypto traders!
Don't forget to subscribe to our official CScalp news channel, use trading signals and get to know our bot.
If you have any questions, just contact our platform's support via Telegram at @CScalp_support_bot. We will respond in a matter of seconds.
You can also visit our Discord channel and subscribe to the CScalp TV YouTube channel.
JOIN OUR CHAT