
Top 5 Best Indicators for Day Trading: Discover the Best Indicators for Scalping Crypto
Technical indicators are auxiliary tools for technical analysis. Essentially, they are algorithms that calculate and display different technical aspects of an asset’s price movement. Some of the most popular indicators include the Moving Average (MA), Moving Average Convergence/Divergence (MACD), Volumes, Bollinger Bands, and Relative Strength Index (RSI). Traders use indicators to assess the market and validate a potential entry point. However, the use of indicators in scalping is largely misunderstood. In this article, we will shed some definitive light on the use of indicators in scalping. We’ll explain why scalpers don’t use indicators often, why they sometimes do, and which ones they usually go for.
Attention! This article is for informational purposes only and does not contain recommendations or calls to action.
The review has been prepared by the CScalp terminal team. You can get CScalp by leaving your e-mail in the form below.
Unveiling the Depths of Indicators in Day Trading
In the realm of day trading, indicators hold a dual identity – they serve as both analytical instruments and promotional assets. These tools have an intriguing history, evolving from the expertise of seasoned traders well-versed in mathematics and the intricacies of trading psychology. From their inception, nearly every renowned indicator emerged as an exclusive commodity tailored for prominent investors and institutional traders.
Back in the pre-Internet era, indicators remained the domain of institutional investors, accessible only to those with substantial resources. These deep-pocketed entities perpetually sought out innovative tactics that could amplify their success margins. And the creators of indicators ingeniously capitalized on this demand.
Presently, platforms like TradingView and an array of other charting utilities boast an extensive repertoire of indicators, some of them touted with claims of a staggering “97% win rate”. Interestingly, not long ago, the majority of these tools commanded hefty price tags, some even reaching upwards of $10,000. But here’s the twist – why have these high-value tools transitioned to being freely available?
Read our article: “These Are the Best TradingView Indicators and Tools.”
Chasing The Best Day Trading Indicators: The Elusive Quest
The relentless pursuit of a trading “Holy Grail” has inadvertently fueled a profitable ecosystem for marketers, bloggers, YouTubers, and trading coaches. The curiosity surrounding the ultimate trading secret has birthed a thriving industry, complete with a battalion of content producers eager to ride the wave. They amplify the virtues of the latest coveted indicator or trading program, often lacking substantial evidence of its real-world effectiveness. In essence, the endeavor to track down miraculous indicators often yields minimal returns, rendering the effort futile.
Day Trading Indicators: Uniquely Tailored Tools
This doesn’t imply that technical indicators hold no value. They possess the ability to confirm or debunk a market hypothesis with a reasonable degree of reliability. However, a crucial point surfaces: indicators invariably advocate a specific interpretation of the market, or a mathematical standpoint carefully crafted by their originators.

Bolliger Bands calculation formula
When opting to incorporate a trading indicator into your strategy, several steps are imperative:
- Grasp the rationale behind its necessity.
- Uncover the mechanics governing its computation.
- Subject the indicator to your personal evaluation.
Should it align seamlessly with your trading approach and market outlook, it could potentially serve as a valuable asset. Conversely, if the alignment is absent, utilizing said indicator becomes akin to a mere game of chance.
Indicators: Anchored in the Past
The allure of loading up an indicator is undeniable: its smooth lines trace the trajectories of candlestick patterns. It imparts a sense of mastery over the market, inducing a surge of confidence. This confidence might become overpowering, pushing you to hastily enter a trade the moment those two curves intersect. It’s a seductive thought since the market often appears to surge upon such intersections. However, here lies the paramount rule – this is precisely the impulse you must resist.
True, indicators are categorized into leading and lagging types, yet they universally present historical data. Even the leading ones lack the capability to foresee the future. Their readings are an amalgamation of averages and real-time adjustments, giving rise to the illusion of clarity.

Optimal Scalping: Indicator Insights
Delving into the realm of scalping, the quest for the ultimate indicator persists. However, it’s crucial to comprehend that scalping and indicators don’t often align. In nearly 90% of cases, indicators play a limited role, with a consensus forming among scalpers – indicators largely lack utility within this trading approach.
In essence, scalping thrives on an indicator-free methodology. This stems from various reasons, including:
- Skill-Centric Approach: Proficiency in deciphering the order book, clusters, and the tape eliminates the necessity for additional entry parameters.
- Formulaic Delay: Indicators rely on calculations and present readings with a lag. In scalping, where every second matters, this lag becomes a substantial drawback.
- Timeframe Mismatch: Scalping timeframes (M1/M5/M15) seldom align with conventional trading indicators, which require H1 timeframes to exhibit dependable data devoid of excessive noise.
- Clarity and Simplicity: Scalpers gravitate towards simplicity. Indicators, often rooted in complex formulas and potentially distorted data, do not align with this principle.
- Contradictory Nature: Indicators frequently contradict each other, leading to ambiguity in determining the accurate signal amidst the noise, which squanders valuable time.
- Microscopic Perspective: Scalpers adopt a microscopic market outlook, akin to a laboratory setting. This makes using indicators to scalp like using binoculars in a lab: an unnecessary burden.
For novices, indicators might offer a rudimentary understanding of the market’s dynamics, presenting an alternate viewpoint. However, as one evolves into a proficient scalper, indicators tend to unveil their own redundancy. The capability to discern valuable insights from superfluous ones comes with time, practice and dedication.
How to Use Day Trading Indicators in Scalping
For novices and burgeoning scalpers, a strategic use of indicators can indeed find its place – but strictly in conjunction with an array of other analytical tools. It’s vital to refrain from giving indicators too much importance in your strategy. Instead, they should assume a subordinate role, ideally employed as a final recourse, if at all.
When incorporating technical indicators into the realm of scalping, a cautious approach is paramount. Their consideration should arise solely after the formulation of an entry rationale. Recognizing that indicators often yield erroneous signals, it becomes imperative to complement their insights with vigilance towards price action and supplementary factors like volume.
The crux of using technical indicators in scalping lies in their contextual integration. Begin by meticulously pinpointing an entry juncture, wielding the trifecta of scalping fundamentals: the order book, the tape, and clusters. Subsequently, delve into volume analysis, all while reserving a peripheral glance for any intriguing indicators you might encounter.
The Best Indicators for Scalping and Day Trading
With the above disclaimers out of the way, let’s take a look at some of the indicators that can prove useful when it comes to scalping and day trading:
Trading volume
Volume is the only indicator that is really worth a scalper’s while — hence its place in the CScalp terminal. Volume shows the actual amount of an asset in lots that has been traded on the last candle. Each tick of the histogram is formed immediately after the close of the last candle, and is colored after it. Volume calculation is simple: it’s the sum of lots for the selected time frame. This makes it the most responsive and reliable indicator for scalping.

Volume indicator (bottom) in the CScalp terminal
Volume reflects market activity, which can help you spot whales and foresee a trend. In scalping, the volume indicator is used as one of the key criteria for the strength of a level: if volumes increase at each touch of the level, then the level is strong (and vice versa). High volumes near levels always portend some kind of strong impulse movement. Large volumes dumped on the market result in a liquidity surge, and if the resistance is not strong enough, they often signify a breakdown. The volume indicator displays the actual balance of supply and demand in the market, exposing the current moods of the participants. That’s why the volume indicator is the only truly indispensable indicator for scalping.
The Relative Strength Indicator (RSI)
What is the Relative Strength Indicator (RSI)
The Relative Strength Indicator is one of the simplest and most popular technical indicators. More often than not, the RSI indicator is used in swing trading and mid-term trading.

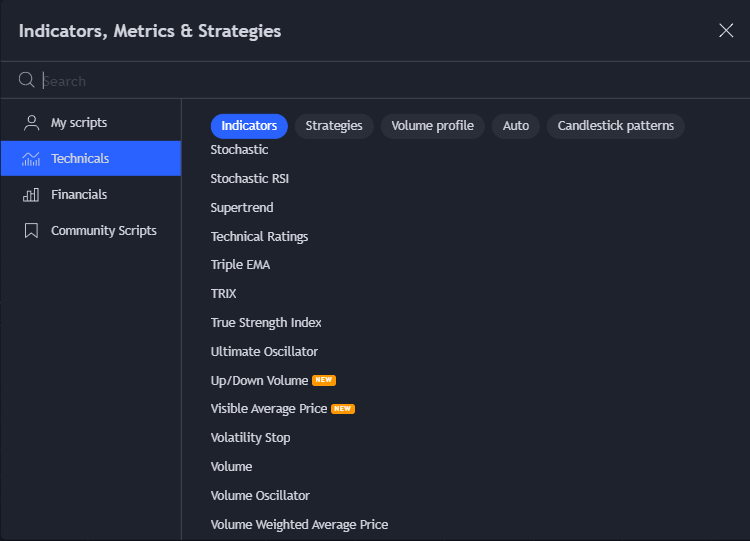
The RSI indicator in the TradingView interface
The ultimate goal of the RSI is to show whether the market is overbought or oversold. It helps traders determine the market trend and find potential reversal points.

RSI oscillator: red shows the moments of crossing level 30, and green shows the subsequent price growth
Visually, the RSI is displayed as a line resembling a small copy of the chart. In most terminals, the indicator is placed under the main chart of a trading instrument (candles, bars, lines).
How to Set Up The Relative Strength Indicator (RSI)
To properly set up the RSI, you need to understand how RSI periods work. The period (RSI length) is the number of trading periods (candles) the indicator collects data from. Length 14 means that the index will look at the past 14 candles, length 10, the past ten candles, and so on. The ideal length is considered to be 14, but scalpers are better off experimenting with lower amounts. The developer of the indicator, Wells Wilder, recommended 14 as the optimal setting, but he wasn’t a scalper.
The RSI indicator uses information averaging. The more data, the more accurate the derived average. However, setting the length too high is not recommended – candles that are too old grow irrelevant and can degrade the indicator’s readings.

The RSI indicator settings window in the TradingView terminal
How to Use The Relative Strength Indicator (RSI)?
To understand how to use the RSI indicator, you need to take into account that RSI is an oscillator, i.e. a line fluctuating between upper and lower boundaries.

The RSI indicator in the TradingView interface
The RSI is placed in the space outlined by levels 0 – 100. Zero is a concentrated bearish value – the maximum oversold signal. 100 is a purely bullish value, maximum overbought.
Levels 30 and 70 are of key importance in trading: that’s where the oversold and overbought zones start. In theory, if the RSI line crosses 30 from top to bottom, you can expect a rally. If it crosses 70 from the bottom up, a sell-off is afoot. The viability of these signals largely depends on your choice of timeframe.
Stochastic and Oscillator RSI
RSI indicates only the prevailing direction of candles in the previous time period, which cannot guarantee viable trading signals. The instrument needs to look at more data – and that’s why Stochastic RSI was developed.

Stochastic RSI
Stochastic RSI looks like two oscillating lines intertwined with each other. The overbought and oversold boundaries are narrowed here. Instead of 30 and 70 as in the standard RSI, the Stochastic corridor is set between 20 and 80. Traders look for a signal when both instrument lines cross the boundaries of 20 or 80. Together with the regular RSI, StochRSI can help a trader filter off the noise and ‘sync the clock’ on a potential entry point.
RSI Divergence and Convergence
RSI Divergence is the visible divergence of the candlestick trend and the indicator. Such divergence can be viewed as a ‘slingshot’ for the next price movement. The longer the price goes against the direction of the RSI chart, the more certain the RSI signal becomes

An example of a divergence in the RSI, a signal that the price could fall
In the screenshot above, the local candlestick trend is going up while RSI says that the trend is down. In this case, we should prepare for a bearish trend (and vice versa).

RSI indicator trading strategy is explained on the Bitcoin chart
Divergence can also signal a trend reversal. In this case, the candle chart points to a downtrend, while the lows on the RSI line are clearly rising. This may indicate a bullish period afoot. Unlike other types of indicator readings, RSI divergence can be taken as a signal to open or close a position.

Convergence example. The trend defined on the chart corresponds to the signal from the RSI
RSI Convergence is when the signals from the indicator follow the current candlestick trend. Most of the time, the indicator and the candle chart are in convergence. This is where you typically deploy some of the strategies explained below.
Common RSI Strategies
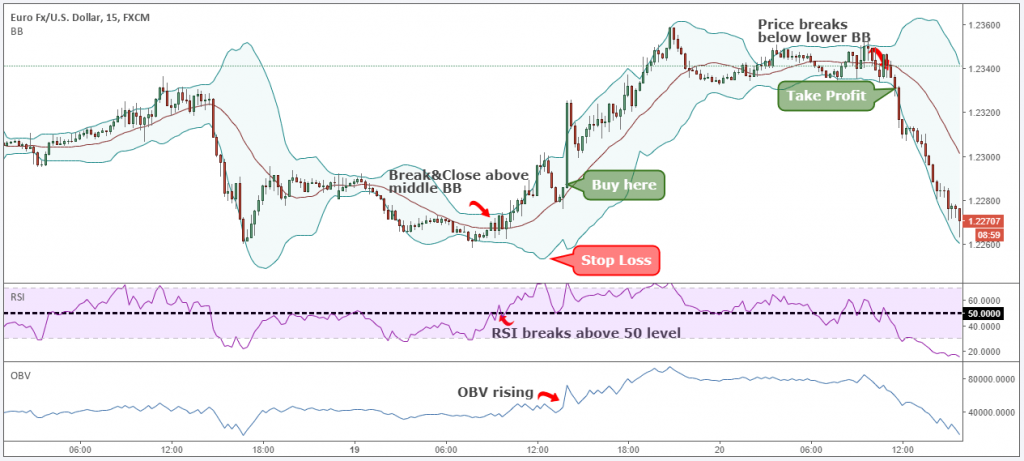
The classic RSI strategy is to buy when the line bounces off the 50 mark or passes it from below. Another standard trading pattern is to buy when the line crosses the 30 mark from top to bottom. You can sell when the line crosses the mark 70 from the bottom up — or open a short position at RSI 70 and then close it at a profit once it hits 30.
The caveat is that the amount of time it will take the RSI to move from one border to another can never really be predicted. It could be hours or even days before that happens. Whether you’re trading intraday or mid-term, you need to carefully choose what timeframe you’re using the RSI on. Moreover, the indicator may generate a lot of false signals, only approaching the desired mark but never quite hitting it. This may result in false analysis and erratic decision-making, so be aware of this limitation.

An example of a buy signal after crossing level 30
The Moving Average (MA)
What is a Moving Average (MA)
MA is the average price of an asset over a specific period of time. An MA looks like a curved line following price movements. It is used for the convenience of price analysis. The moving average is a lagging indicator, and is most applicable to day trading and swing trading, but not so much for scalping.
Types of Moving Averages
There are several types of MAs: simple moving average (SMA), exponential moving average (EMA), weighted moving average (WMA), and other derivatives. MAs are used to determine the current trend by averaging sharp price fluctuations (market noise). The indicator slides along the chart, smoothing out the price profile.
Simple Moving Average (SMA)
The simple moving average does not show exact changes on the chart due to the over-generalization of the data.
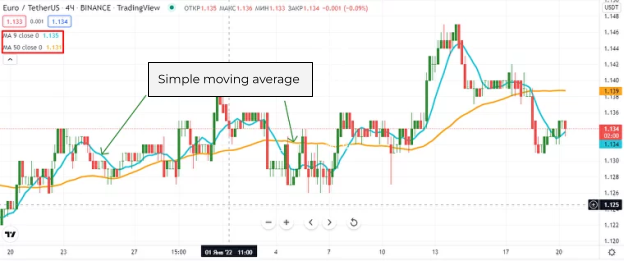
This is because each price value in the formula is applied with the same priority of significance. To obtain more correct data, more priority is given to the latest prices. For this, the EMA is used.
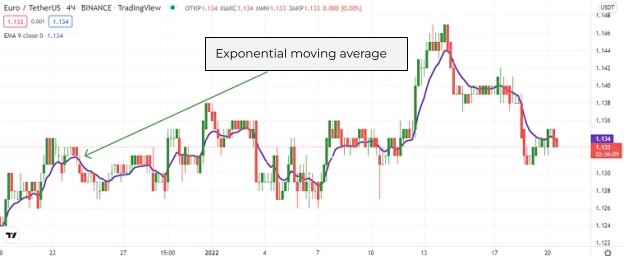
Exponential Moving Average (EMA)
An exponential moving average is used to give more priority to recent price data, allowing for more accurate readings. Sharp price changes are not taken into account. EMA is much more sensitive than SMA. Therefore, if used incorrectly, it can give more false signals, especially when misconfigured.
Moving Average Convergence/Divergence (MACD)
What is the Moving Average Convergence/Divergence (MACD) Indicator?
The MACD elps predict price movement based on the relationship between two moving averages.
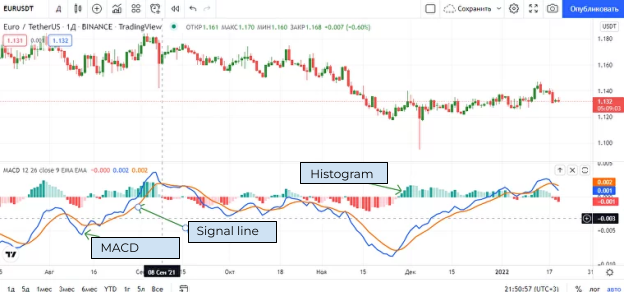
MACD consists of three components:
- MACD line: This is the difference between EMA with a period of 12 and EMA with a period of 26. It is faster and more sensitive to market changes (shown in blue).
- EMA, period 9: The line is designed to generate the main signals (shown in brown).
- Bar chart: Shows the difference between the two previous curves. It is displayed as red and green bars, depending on the location relative to the zero mark.
It can be useful to look for divergences on the MACD chart as a way of reinforcing your theory. The most practical signal for scalpers and day traders would be a divergence between the main candlestick chart and the MACD. Such a divergence most often precedes a definitive price movement or a reversal of the current trend.
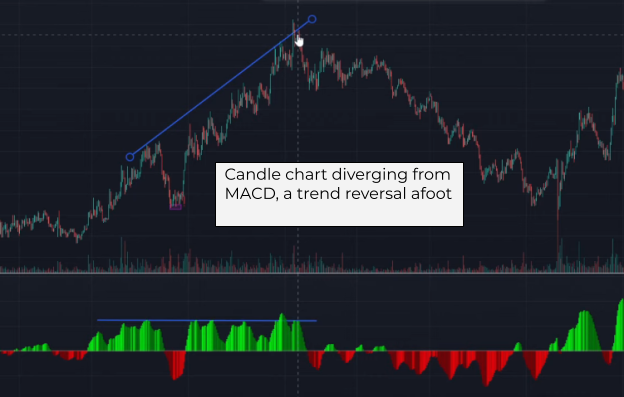
Still, MACD is a lagging indicator, and more often than not it adds complexity rather than clarity to a scalper’s workflow.
Bollinger Bands
Bollinger Bands are composed of three SMAs:
- The middle line, SMA 20, characterizes the main price direction.
- The upper line is the same SMA 20 shifted 2 standard deviations (STD) forward.
- The bottom line is shifted 2 standard deviations (STD) back.
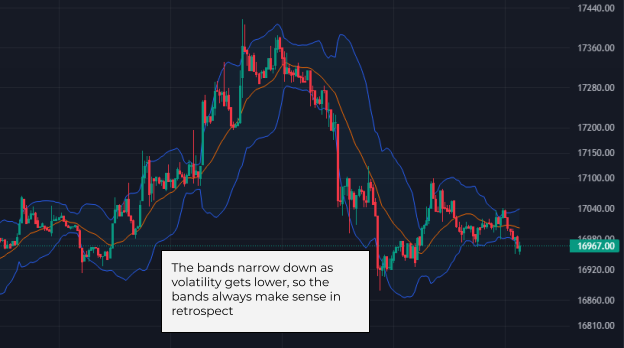
Using the 3 moving averages, the bands aim to visualize the ongoing volatility. The range usually tightens in anticipation of a strong movement. During a strong move, the bands expand and remain so as the trend goes on. Towards the end of a move, they tend to ‘deflate’ and become tighter again, signifying an upcoming flat or correction.
Most of the time, the price action is contained within the upper and lower bands. However, looking at the historical performance, one might notice that sometimes the price breaks beyond the bands, much like a needle piercing a balloon. Usually, this happens at pivotal points that precede strong, definitive movements. These breaches of the Bollinger bands by the price are considered buy and sell signals. When the price breaks through the lower band, traders consider buying, and when it pushes above the upper range, one should consider selling. However, this rule is not universal. It depends on the overall price action and other parameters.
The Bollinger Bands indicator is best used in conjunction with Stoch RSI or MACD to substantiate your positions:
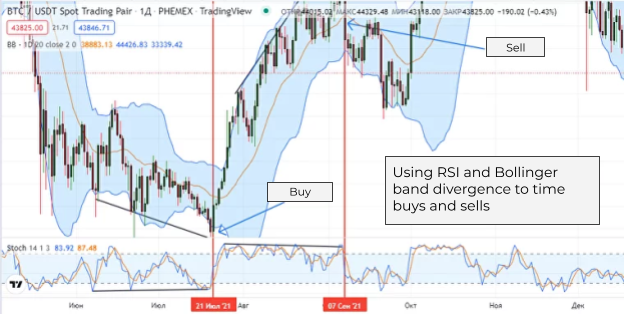
Together with the MACD divergence, Bollinger Bands can generate fairly reliable buy/sell signals.
Even though Bollinger bands provide helpful data points, it’s still a lagging indicator that is redrawn as soon as fresh data comes in, undermining the positions you took using this indicator alone.
Best Indicators in Scalping: Summarizing the CScalp Stance
Within this discourse, we echo both the sentiment of the CScalp team and the broader scalping community concerning the role of indicators in scalping strategies. The rationale expounded above underpins the exclusion of all indicators, barring trading volume, from the CScalp terminal. However, this stance doesn’t proclaim a perpetual ban on indicators. In fact, indicators encapsulate a plethora of distinct mathematical perspectives on the market.
However, a critical juncture arises where some traders opt for judicious allocation of their time and resources. In the sphere of scalping, delving into indicators might not align with optimal priorities. Why divert valuable time towards indicators when alternative avenues provide profound market insights? Such analysis aptly belongs to market theorists, for scalpers thrive on a different trajectory.
For scalpers, time invested in decoding indicators detracts from honing their craft. An unequivocal lesson dawns upon every practicing scalper – indicators predominantly prove inefficient. Ultimately, scalping flourishes best in their absence, as practitioners eventually realize that relying on indicators is an unwarranted endeavor that rarely justifies the time and energy invested in analyzing them.
Join the CScalp Trading Community
Join our official trader's chat. Here you can communicate with other scalpers, find trading soulmates and discuss the market. We also have an exclusive chat for crypto traders!
Don't forget to subscribe to our official CScalp news channel, use trading signals and get to know our bot.
If you have any questions, just contact our platform's support via Telegram at @CScalp_support_bot. We will respond in a matter of seconds.
You can also visit our Discord channel and subscribe to the CScalp TV YouTube channel.
JOIN OUR CHAT