Best Settings For Bollinger Bands
When developing a trading strategy, a trader seeks to minimize the number of technical indicators used, while getting the most information possible.
This approach is favorable because a multitude of instruments on the screen worsens the overall perception of the market, and often obfuscates the analysis with false or conflicting readings.
The Bollinger Bands (BB) indicator aims to solve these problems.
The CScalp team prepared an article about this classical indicator for technical analysis, its proper use and best settings.
Attention! This article is for informational purposes only and does not contain recommendations or calls to action.
The review has been prepared by the CScalp terminal team. You can get CScalp by leaving your e-mail in the form below.
The history of Bollinger Bands
The indicator was invented in 1984 by John Bollinger, a technical analyst from California. It was first described in Parry Kaufman’s book “The New Commodity Trading Systems and Methods”.
When creating the indicator, Bollinger was guided by the goal to create his own system for analyzing and calculating investments. Having worked on it for about seven years, in the early 90s he presented his system to the investment and trading community. The indicator quickly gained popularity, and was adopted by many traders worldwide. John Bollinger is currently the owner of Bollinger Capital Management inc.
John Bollinger described the entire mechanism of his indicator in detail in his book, “Bollinger on the Bollinger Bands”. In 1996, he was recognized as the best developer of software for financial markets.
What are the Bollinger Bands?
The idea of the Bollinger Bands is to combine a trend indicator, a volatility indicator and an oscillator. The bands indicate the direction and range of price fluctuations on the chart, taking into account the trend and volatility characteristic of the current market phase.
In essence, the Bollinger Bands is an indicator that shows exactly how much the price of assets in the market is changing.
The indicator looks like two bands enclosing the price movement above and below. The borders of the bands are akin to support and resistance levels, and most times they are some distance away from the price.
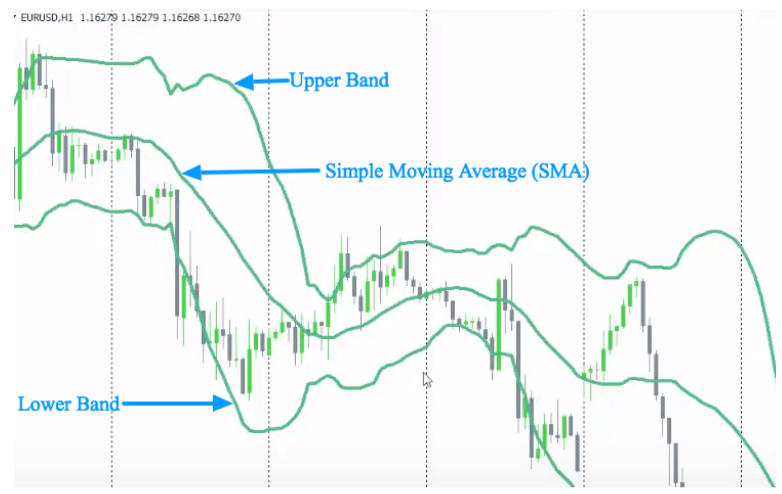
The Bollinger Bands
Bollinger Bands are formed by three lines:
- The simple moving average is an ordinary moving average with a period of 20;
- The upper band is the same moving average, shifted upwards by the number of standard deviations;
- The lower band is a moving average shifted down by the number of standard deviations.

What Bollinger Bands show
Unlike other indicators, Bollinger Bands show us what’s happening in the market at this very moment – not just what’s already happened. BB can be used both independently and in conjunction with other indicators.
Bollinger Bands reflect the actual state of the market in real time. They represent the key aspects of price movements, such as the beginning and the end of a trend, the beginning of an impulse, a false impulse, a flat, a trend, etc. Simply put, the Bollinger Bands allow you to assess the price movement more accurately and make a more informed decision.
How do Bollinger bands work?
Bollinger Bands are drawn on the chart itself. They are based on a simple moving average (SMA) with a default period of 20 candles. Copies of the 20-period SMA are drawn above and below it at a distance of two standard deviations*. Thus, a trading channel appears. Practice shows that the price tends to move within this channel.
*What is a standard deviation? In simple terms, it is the maximum deviation of price (spread) from its average value in both directions: up and down. For example, let’s say one coin has moved between $70 and $80 for a month, and another has moved between $60 and $90. The average value will be the same for both coins – $45, but the spread will be different: ±$5 for the first one and ±$15 for the second one. In other words, the volatility of the second coin is much higher.
Here is the first lesson of the Bollinger Bands: the price always tends towards its averages. All fluctuations around the moving average are created by speculators. Statistically, if the price deviates by 2 standard deviations, there’s a 95% chance of it returning back to its averages.
The Bollinger Bands formula for Excel and Spreadsheets
The Bollinger Band formula template helps traders instantly calculate trading signals for any market.
Below is the formula to calculate BB in Excel:
Average Band = 20-day simple moving average (SMA);
Upper band = 20-day SMA + (20-day standard deviation x2);
Lower band = 20-day SMA – (20-day standard deviation x2).
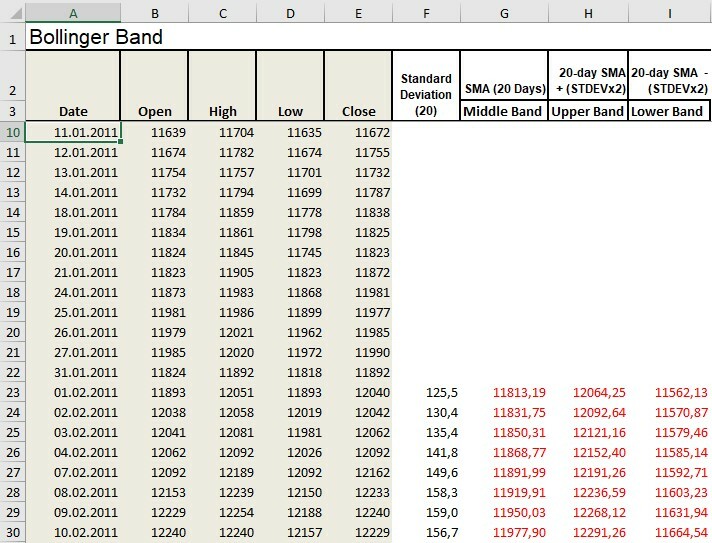
Excel table with the formula for calculating the Bollinger Bands
In the attached Excel template, the column “E” contains the closing price, the column “F” contains the standard deviation, and the column “G” contains the 20 SMA, which is the middle band. The column ”H” contains the upper Bollinger band, which is (20SMA+2STD), and the lower Bollinger band contains (20SMA-2STD).
How to use Bollinger Bands in Trading
Although they are primarily a volatility indicator, the Bollinger Bands are very useful for detecting support and resistance levels. There are several signals that can be generated using this indicator. These signals respond to various price relationships on the chart.
Bollinger Bands BUY and SELL signals
The Bollinger Bands is a universal indicator that can be used both for trading along the trend and during correctional phases. To do so, you need to know what each key price position in relation to the bands means, as well as to take into account the nature of their interaction.
When the price of an asset has been moving in one direction for a long time – it’s in a steady trend. A good entry point is when the price hits the border of the trend channel. For example, if the trend is up, you can buy when the price pulls back and approaches the bottom line.
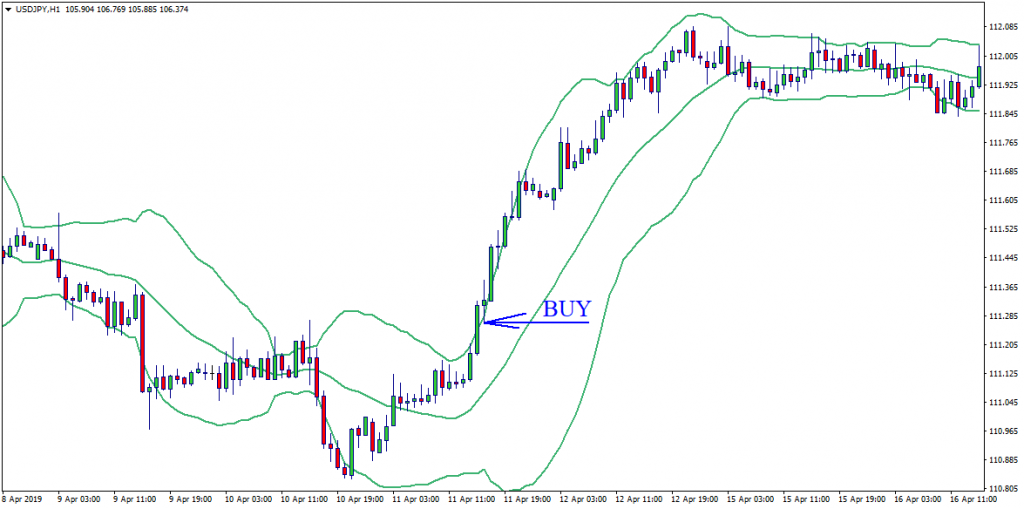
linger Bands: A Buy Signal
Likewise, you can trade against the trend during corrections or prolonged declines: enter a short deal when the price of the asset approaches, or better, goes beyond the borders of the upper Bollinger line.
Another good signal is the price approaching the moving average. The MA often serves as a dynamic support or resistance area. When the price approaches this zone, market participants should look for entry points, which will appear just after the price bounces off the moving average.
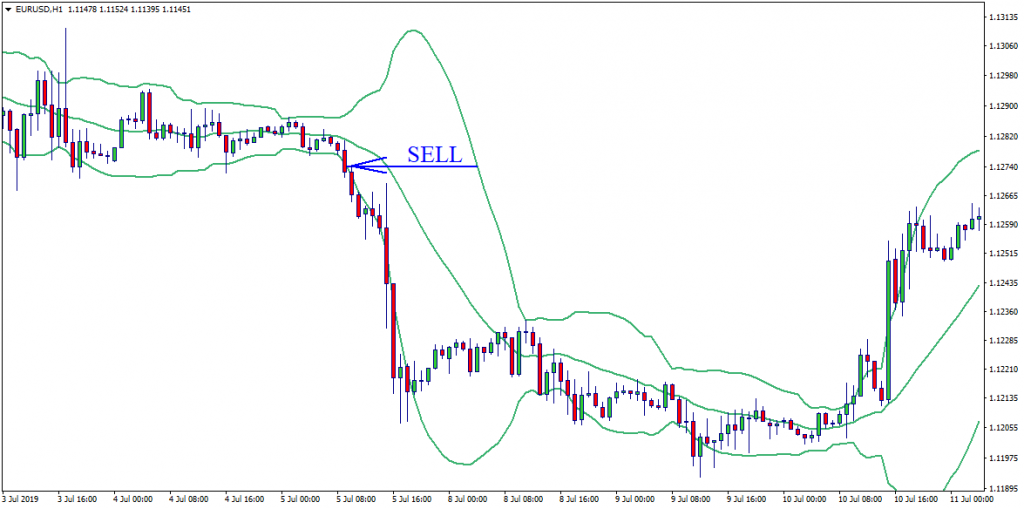
Bollinger Bands: A Sell Signal
To summarize:
- The buy signal is when the price touches the upper line of the indicator, and continues to grow, with the midline in this case, being the support level.
- The sell signal is when the price touches the bottom line of the indicator and continues to fall. In this case, the middle line will be resistance.
Bollinger Bands settings in scalping
Among other things, Bollinger Bands measure volatility, making it a great indicator for scalping.
Scalp traders using Bollinger Bands should also use other indicators to define more accurate market entries.
It is best to use a moving average to determine the trend and the Stochastic indicator for entering the market.
Scalpers who use the Bollinger Bands in trading, can adhere to the following rules:
- Time frame – M5;
- Indicators – Bollinger Bands with the following settings: a period of 20, 2 standard deviations;
- Stochastic Oscillator with the following standard settings (14, 5, 3) as a filter.
The scalping strategy when working with Bollinger Bands is based on finding a stable situation in the market, when the price is not making new highs or lows.
Strategy for a long entry
You should enter a long position when the price touches the bottom Bollinger Band and the Stochastic Oscillator is in the oversold zone.
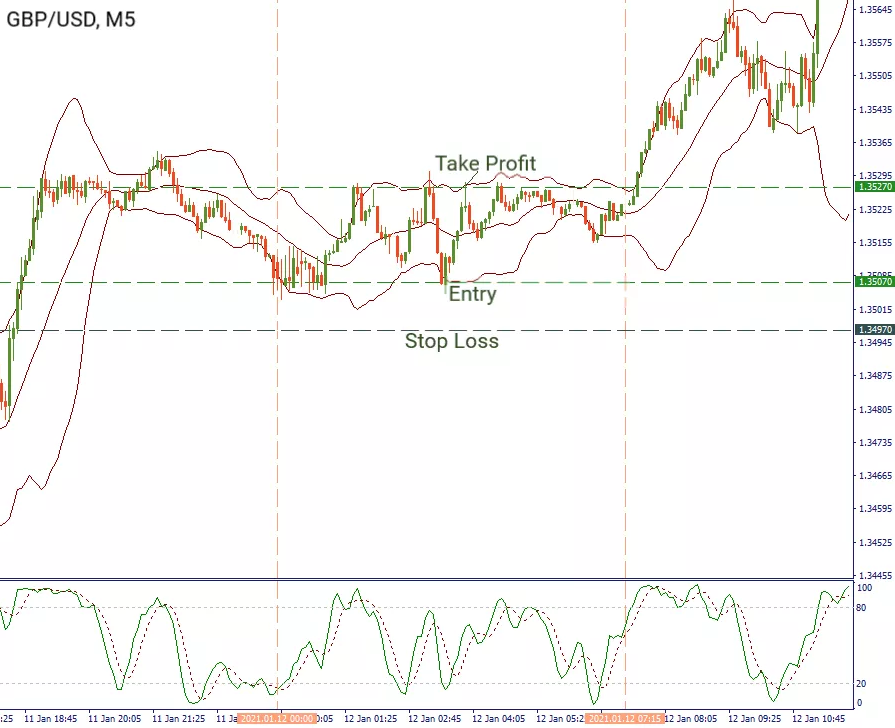
Trading strategy for a long entry
The trader may place a Stop Loss 10 pips below the level at which the order was placed. If you think that such a Stop Loss is too risky, then you can calculate the distance between the middle and lower Bollinger Bands. The wider the range between the Bollinger Bands, the larger your Stop Loss will be. Close your position when price touches the upper Bollinger Band.
Strategy for a short entry
Place a short order as soon as the price touches the upper Bollinger band and the Stochastic Oscillator is in the overbought zone.
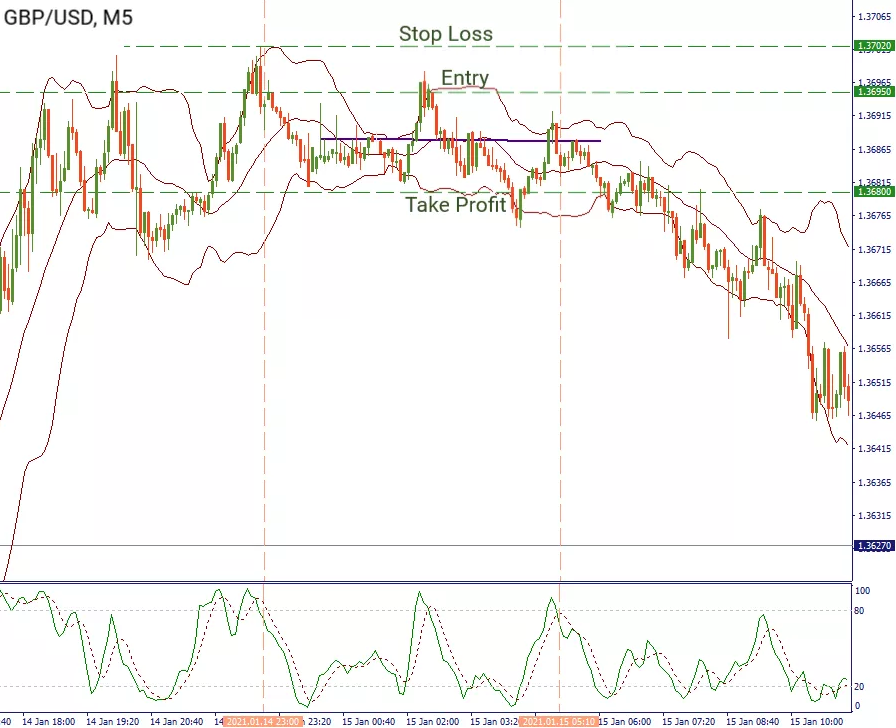
Trading algorithm for a short entry
It’s important to place the Stop Loss 10 points above the level at which the order was placed. There’s another way of placing a Stop Loss: calculate the distance in points between the upper and middle Bollinger Bands, and then add the result to the entry level. You can place a Stop Loss at the resulting distance. The position should be closed when the price touches the lower Bollinger Band.
Bollinger Bands settings in day trading
In day trading, the Bollinger Bands indicator works well with other oscillators indicating overbought or oversold areas. One of them is the Commodity Channel Index (CCI).
The Commodity Channel Index (CCI) is an oscillator used in technical analysis to measure the deviation of a security’s price from its statistical average.
To define a profitable entry/exit into the market, one should follow the price movement inside the Bollinger Bands as well as the crossing of the CCI and the moving average.
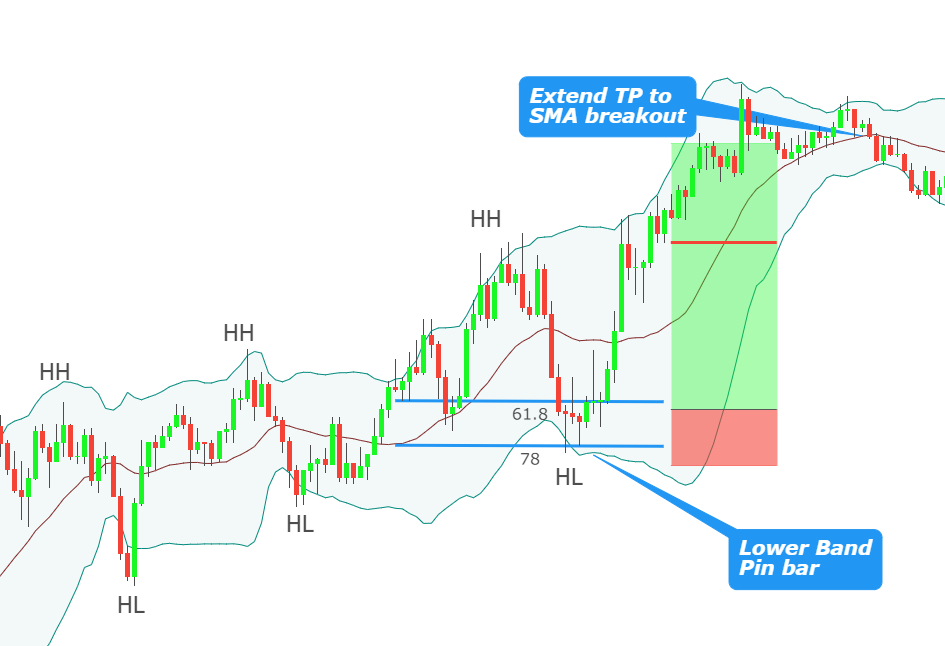
Bollinger Bands settings in day trading
In day trading, the period of movement of the average line should be close to 20, and the optimal value of the standard deviation will be 2.
Here are some guidelines a day trader should follow when using the Bollinger Bands:
- Use a M15 timeframe;
- The Bollinger Bands should be drawn with a 50-period moving average and a standard deviation of 2;
- It’s best to load a 50-period Commodity Channel Index (CCI) indicator on the chart;
- You should also add a 200-period exponential moving average on the CCI (not on the price chart);
- Only follow the buy signal if it appears above the average Bollinger Band.
- Only follow a sell signal if it occurs below the average Bollinger Band;
- It’s better to place the stop loss below the Bollinger Bands or below the corresponding recent market fluctuation.
Bollinger Bands settings in swing trading
Bollinger Bands are also useful for swing and position trading.
The main advantage of the following strategy is to open positions only in the direction of the trend. The strategy includes two steps:
- Waiting for a pullback before entering a trade;
- Entering the market when the instrument indicates that its price will continue to move in the direction of the prevailing trend.
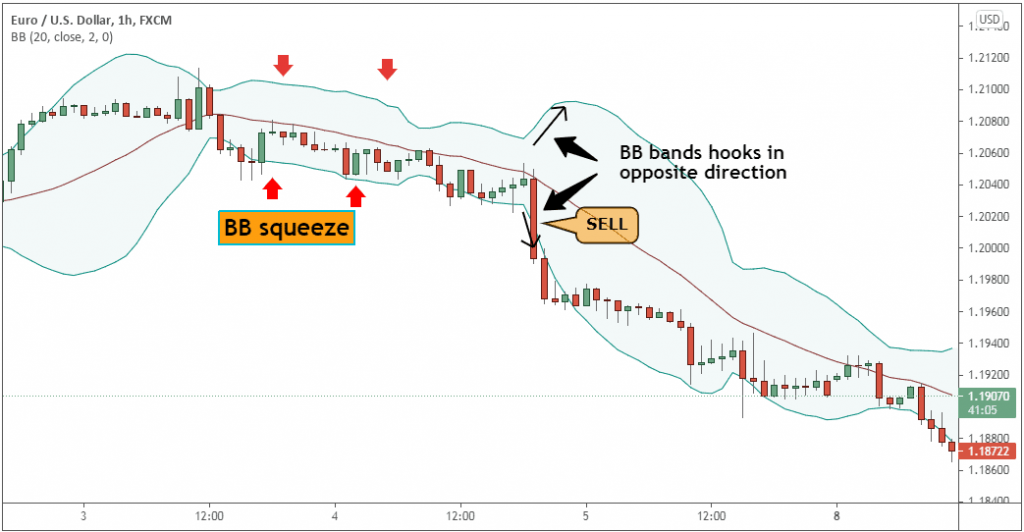
Bollinger Bands swing trading strategy
Here are the main recommendations swing traders can follow:
- Use higher time frames, H4 or daily charts;
- Build Bollinger Bands with a 50-period moving average and a standard deviation of 2.5;
- Ideally, if a trader wants to trend for as long as possible, they should use a trailing stop;
- Placing a stop loss above or below the Bollinger Bands.
The moving average line in swing trading will be 50, and the standard deviation value will be 2.5.
Bonus: Bollinger bands trading strategies
Bollinger Bands is a universal analysis tool that can be used in all markets. Let us consider some popular strategies for trading with this indicator.
Narrowing and Expanding
The Bollinger Bands warn the trader in advance that the volatility of an instrument is decreasing, and its fluctuations around the moving average are gradually fading. You should wait for the price to move out of the existing price corridor, either up or down.

The Narrowing and Expanding strategy
Line Breakdown
You can use the Bollinger Bands when the price comes close to or even slightly crosses the upper or lower limit of the band. In most cases, the price pushes itself away from the boundary, which allows the trader to take a profitable trading position in advance.
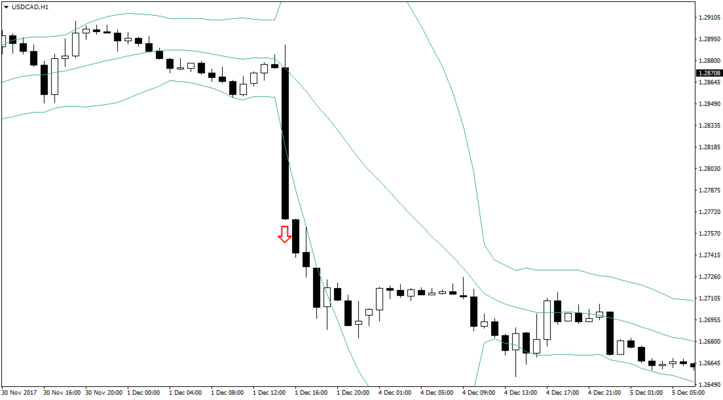
The Line Breakdown strategy
Riding the Bands
When the trend continues, this phenomenon is called Riding the Bands. When a candle touches the boundary from the bottom upwards, the price falls slightly, then bounces back and rises again. When a series of such touches is seen, then that confirms the trend. This is also true for a downtrend. Powerful trends will be visible on the chart, and the entry point is when the candle touches the boundary of the corridor.
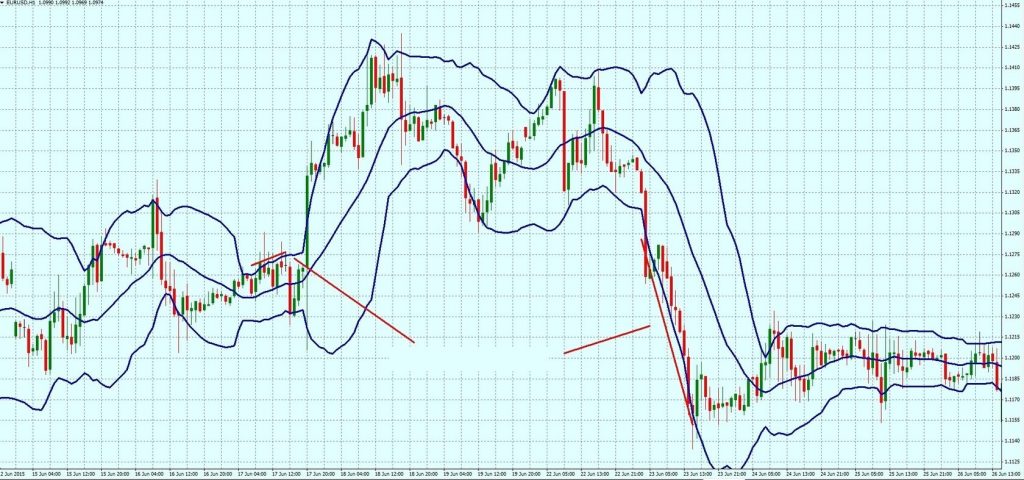
The Riding the Bands strategy
To determine the change in the trend, Bollinger recommends looking for trend reversal figures on the chart.
W-shaped patterns
The use of the BB indicator allows effective work with so-called price formations or patterns. There are two patterns, known as “double bottom” and “double top”, looking like a W and an M, respectively. The appearance of a double bottom or W in the Bollinger Band is an especially good signal that the price of an asset is ready to make a sharp move.
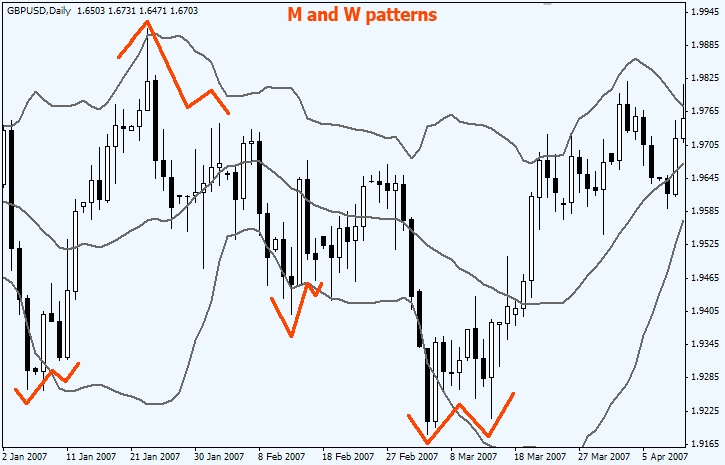
W-shaped and M-shaped patterns within Bollinger Bands
M-shaped patterns
An M-shape in BB is a special case, where stable graphical price patterns are used. In this case, the appearance of the M pattern indicates that the price is ready for a downward reversal.
Conclusion
The Bollinger Bands can be used in many ways. They include overbought and oversold trading signals. In addition to this, traders can add several bands to emphasize the strength of price movement.
Apart from overbought and oversold trading signals, Bollinger Bands can track reductions in volatility. These are usually followed by clear price breakdowns, which in turn are accompanied by significant volumes.
Join the CScalp Trading Community
Join our official trader's chat. Here you can communicate with other scalpers, find trading soulmates and discuss the market. We also have an exclusive chat for crypto traders!
Don't forget to subscribe to our official CScalp news channel, use trading signals and get to know our bot.
If you have any questions, just contact our platform's support via Telegram at @CScalp_support_bot. We will respond in a matter of seconds.
You can also visit our Discord channel and subscribe to the CScalp TV YouTube channel.
JOIN OUR CHAT
