
Boost Your Trading With the RSI Indicator
The Relative Strength Indicator (RSI), one of the best indicators for day trading, stands as a cornerstone in the toolkit of traders. Renowned for its simplicity and effectiveness, the RSI indicator holds immense value, particularly in swing trading and mid-term strategies. Its role in determining market trends and identifying potential reversal points is unparalleled. This guide will serve as your compass through the RSI landscape. From unraveling its meaning and calculation intricacies to providing actionable insights into how to wield it effectively, we leave no stone unturned. Grasp the essence of RSI and discover how it can elevate your trading results to the next level.
Attention! This article is for informational purposes only and does not contain recommendations or calls to action.
The review has been prepared by the CScalp terminal team. You can get CScalp by leaving your e-mail in the form below.
What is the Relative Strength Indicator (RSI)?
The Relative Strength Index (RSI) is a pivotal momentum oscillator used by traders to ascertain whether a market is in a state of being overbought or oversold. This fundamental information is a cornerstone in helping traders discern prevailing market trends and pinpoint potential turning points in those trends.
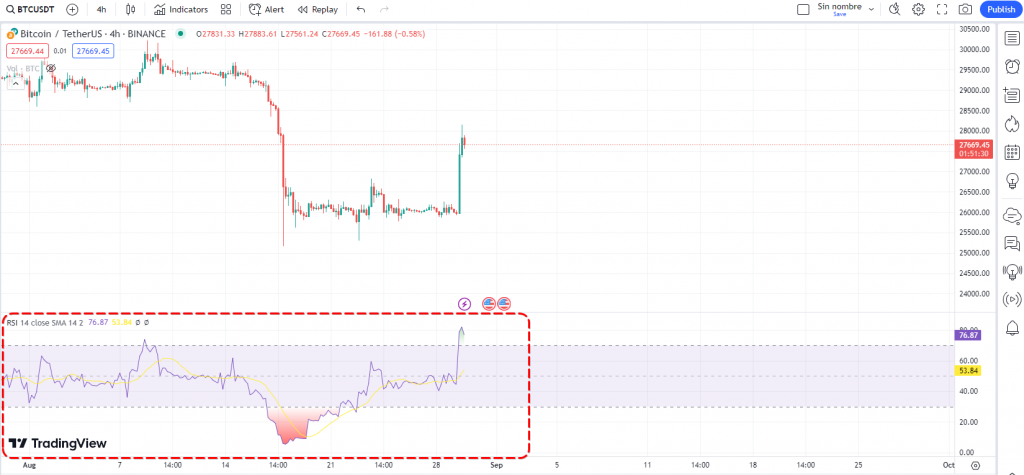
Visually, the RSI presents itself as a condensed replica of the price chart, often finding its designated place just below the main trading instrument chart. This positioning provides traders with a quick reference to the RSI’s insights while simultaneously observing the price movements.
Moreover, the RSI operates as an effective measure of both the speed and the alteration in price movements. It plays a crucial role in conveying whether a market is in a condition of overextension (overbought) or excessive downward momentum (oversold), indicating the possibility of an imminent trend reversal. This capacity to predict reversals enhances its significance as a technical indicator in the trading realm.

Setting Up the RSI
To set up the RSI indicator correctly, it is important to understand the concept of RSI periods. The period, also known as RSI length, refers to the number of trading periods (candles) the indicator considers when collecting data. The default period is 14, meaning the RSI looks at the past 14 candles. However, the ideal length may vary depending on your trading style and preferences. Scalpers, for example, may experiment with lower periods to capture shorter-term price movements.
The RSI indicator uses data averaging, where more data leads to more accurate averages. However, setting the length too high is not recommended as it can make older data irrelevant and degrade the indicator’s readings.
How is RSI Calculated?
The RSI formula involves calculating the relative strength (RS) and plugging it into the RSI formula. RS is determined by comparing the average upward price changes to the average downward price changes over a specific period.
The RSI formula itself is:
RSI = 100 – (100 / [1 + (Average Gain / Average Loss)])
The RSI calculation process involves collecting data on closing prices, calculating gains and losses, and then determining the value. This value is then used to compute the final RSI reading.
How to Use RSI Indicator in Trading?
The RSI is an oscillator that fluctuates between upper and lower boundaries, indicating overbought and oversold conditions. The RSI scale ranges from 0 to 100, with zero representing a concentrated bearish value (maximum oversold) and 100 representing a purely bullish value (maximum overbought).
Key levels to watch in RSI trading are 30 and 70, which mark the start of the oversold and overbought zones, respectively. When the RSI line crosses above 30 from the bottom up, it can signal a potential rally. Conversely, when the RSI line crosses below 70 from the top down, it may indicate a sell-off. The effectiveness of these signals depends on the chosen timeframe, so it is important to consider the context in which they occur.
Stochastic RSI
To enhance the RSI indicator’s effectiveness, traders often use the Stochastic RSI, which provides a more detailed view of market conditions. The Stochastic RSI intertwines two oscillating lines and narrows the overbought and oversold boundaries. Instead of using 30 and 70 as in the standard RSI, the Stochastic RSI sets its boundaries between 20 and 80. Traders look for signals when both lines cross these boundaries, providing potential entry points and filtering out noise.
RSI Divergence and Convergence
RSI divergence and convergence are potent tools that unlock the art of anticipating potential market reversals. Divergence arises when the price trend and RSI indicator venture in opposite directions. This dynamic insight, a confluence of historical price action and RSI patterns, can be a game-changer for traders seeking early trend signals.
Consider an upward price trend juxtaposed with a downward-trending RSI – a divergence indicative of a possible bearish phase. Conversely, if the price is spiraling downwards while RSI showcases rising lows, it’s a subtle nod to an impending bullish turn. This interplay serves as a valuable prompt for strategic trade execution.
Embracing divergence is an audacious approach to leveraging RSI’s power. It allows traders to identify trends in their infancy, potentially leading to enhanced profitability. Picture a downtrend marked by declining price bottoms, juxtaposed with ascending RSI lows. This convergence signals diminishing trend strength and momentum, raising the prospect of an impending price surge. The same principle applies in an uptrend – the RSI displays lower highs, while price chart peaks ascend.
In contrast, convergence aligns the RSI and price chart signals. This synchronization confirms the ongoing market trend, providing traders with a reliable anchor in decision-making.
RSI divergence and convergence are pivotal in turning data into actionable insights. Yet, harnessing their full potential requires a blend of analytical precision and prudent execution, setting the stage for more informed and profitable trading strategies.
Common RSI Indicator Strategies
Relative Strength Index (RSI) strategies unlock a realm of techniques empowering traders with insights into market dynamics. This approach revolves around translating gains and losses into actionable signals, with a default 14-day timeframe that can be tailored to specific trading preferences.
At its core, RSI captures price momentum, indicating optimal entry and exit points. Overbought conditions are flagged when RSI surpasses 70, while values below 30 signal oversold markets. This flexibility makes RSI adaptable to various security contexts. Market ranges, spanning 40-90 during bullish phases and 10-60 during bearish trends, provide additional insights.
Beyond momentum, the RSI indicator unveils chart patterns and enables divergence detection. Bearish divergence suggests impending bearish trends, while bullish divergence signals forthcoming bullish phases. Classic RSI tactics involve RSI line interactions with marks like 50 and 30. However, the timeframe for RSI movements remains unpredictable, demanding careful timeframe selection.
RSI strategies merge historical data, interpretive skills, and strategic execution. This tool’s complexity requires a balanced approach, blending confidence and caution to harness its true potential.
Bolster Your Market Analysis With the RSI Indicator
The Relative Strength Indicator (RSI) is a powerful tool that can help traders analyze market trends, identify potential reversals, and improve their trading performance. By understanding the meaning of RSI, its calculation process, and various strategies, traders can effectively incorporate this indicator into their trading toolbox.
It is important to note that while the RSI indicator provides valuable insights, it should not be used in isolation. Consider the overall market context, use additional confirmation tools, and practice risk management to make informed trading decisions.
Related article: How to Use the MACD Indicator in Trading
Join the CScalp Trading Community
Join our official trader's chat. Here you can communicate with other scalpers, find trading soulmates and discuss the market. We also have an exclusive chat for crypto traders!
Don't forget to subscribe to our official CScalp news channel, use trading signals and get to know our bot.
If you have any questions, just contact our platform's support via Telegram at @CScalp_support_bot. We will respond in a matter of seconds.
You can also visit our Discord channel and subscribe to the CScalp TV YouTube channel.
JOIN OUR CHAT