
Which Indicator Is Best for Scalping Cryptocurrencies?
Are you wondering which indicator is best for scalping? CScalp highlights the most popular technical indicators and how to apply them with the best pairs for scalping. From moving averages to the MACD and RSI, we will uncover the best indicators that can help you make informed decisions in fast-paced cryptocurrency markets.
Attention! This article is for informational purposes only and does not contain recommendations or calls to action.
The review has been prepared by the CScalp terminal team. You can get CScalp by leaving your e-mail in the form below.
Understanding the Importance of Scalping Indicators
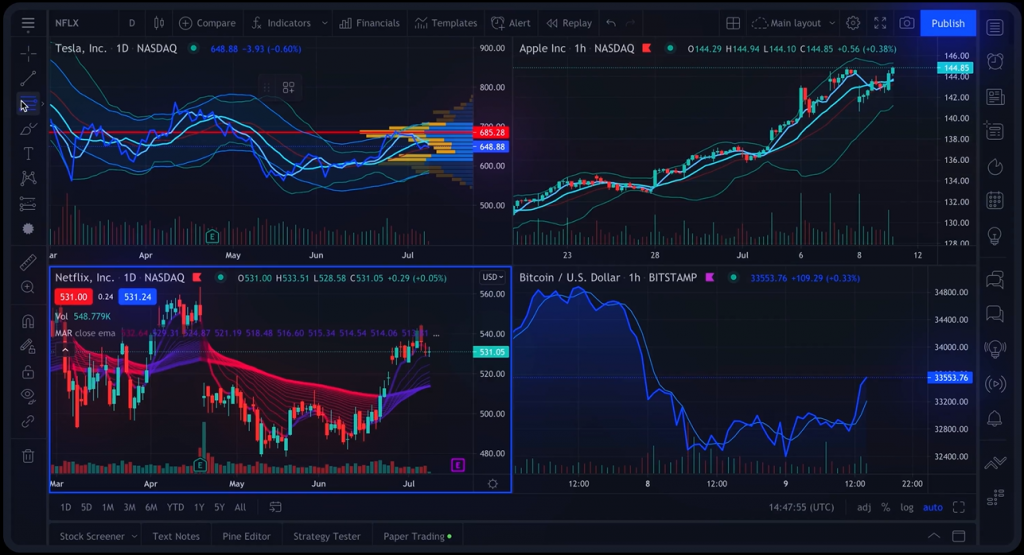
When it comes to cryptocurrency scalping, understanding the importance of indicators is crucial. Scalping, as a trading strategy, focuses on taking advantage of short-term price fluctuations to generate quick profits. To achieve this, traders rely on trading tools and indicators that provide valuable insights into market trends, momentum, and volatility.
Scalping indicators serve as essential tools for traders looking to capitalize on rapid price movements within short timeframes. By analyzing market trends, momentum, and volatility, scalpers can make quick and informed decisions to enter and exit trades. Key indicators such as Moving Averages, Relative Strength Index (RSI), and Bollinger Bands offer vital information about market trends and volatility, assisting traders in identifying optimal entry and exit points.
Understanding and effectively utilizing various scalping indicators can significantly enhance a trader’s ability to make informed decisions and execute successful scalping strategies. It is worth mentioning, however, that professional scalpers rely mostly on order book densities that can be identified through trading software like CScalp. Download the free terminal by leaving your email in the form above and try your scalping skills.

The Role of Moving Averages in Cryptocurrency Scalping
Moving averages play an important role in analyzing price trends and determining optimal entry and exit points. Moving averages are effective indicators that help traders identify the direction of a trend and filter out noise in the market.
The Simple Moving Average (SMA) Indicator
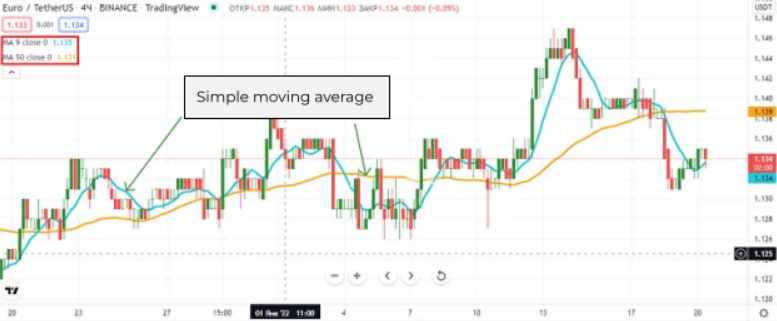
The Simple Moving Average (SMA) is a widely used indicator in cryptocurrency scalping strategies. It calculates the average price over a specific period by summing up the closing prices and dividing it by the number of periods considered. This moving average smooths out price fluctuations and provides a clearer picture of the overall trend.
Traders often use the SMA to identify support and resistance levels. When the price crosses above the SMA, it suggests a potential uptrend, while a cross below the SMA indicates a possible downtrend. Additionally, crossovers between different SMA periods, such as the 50-day and 200-day SMA, can signal trend reversals.
The Exponential Moving Average (EMA) Indicator
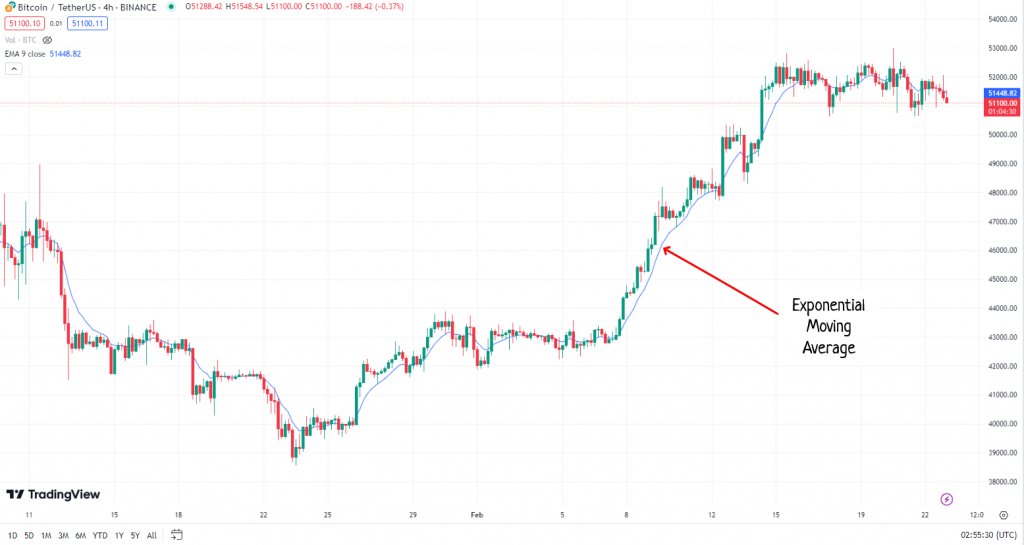
The Exponential Moving Average (EMA) is another popular moving average indicator used in cryptocurrency scalping. Unlike the SMA, which assigns equal weight to all data points, the EMA focuses more on recent price action, making it more responsive to current market conditions.
The EMA reacts faster to price changes, making it useful for traders looking to capture short-term trends. It assigns greater significance to recent data, allowing traders to quickly identify shifts in market sentiment. Similar to the SMA, traders use EMA crossovers and price interactions to determine potential entry and exit points.
Learn more: Which EMA is Best for Scalping Cryptocurrencies?
Incorporating Moving Averages into Your Scalping Strategy
- Use multiple moving averages of different periods to confirm trends and reduce false signals.
- Combine moving averages with other indicators, such as oscillators or volume analysis, for more precise entry and exit points.
- Adjust the time periods of the moving averages based on the cryptocurrency and the time frame you’re trading.
- Regularly review and update your MA settings as market conditions change.
Exploring the MACD Indicator and Its Application in Scalping
The Moving Average Convergence Divergence (MACD) indicator is a powerful tool for cryptocurrency scalping. It consists of two lines – the MACD line and the signal line – along with a histogram that represents the difference between the two. Traders utilize the MACD indicator to identify potential buy and sell signals, as well as to gauge the overall momentum of a particular cryptocurrency.
When exploring the MACD indicator for scalping, it is essential to understand its interpretation. Traders typically look for two main signals:
- Bullish Signal: When the MACD line crosses above the signal line, it indicates a potential uptrend. Traders often consider this a buying opportunity.
- Bearish Signal: When the MACD line crosses below the signal line, it suggests a potential downtrend. Traders might consider this a selling opportunity.
It’s important to note that the MACD indicator should not be used in isolation, but rather in conjunction with other indicators and analysis tools to validate signals. Scalpers can also utilize the MACD histogram to spot divergences or changes in momentum, providing additional insights.
For effective application of the MACD indicator, traders often consider other factors such as support and resistance levels, trendlines, and candlestick patterns. By combining these technical analysis tools, scalpers can enhance the accuracy of their trading decisions and increase the probability of successful trades.
The Stochastic Oscillator: A Vital Tool for Cryptocurrency Traders
The stochastic oscillator is a powerful indicator that assists crypto scalpers in making informed decisions. This tool helps identify overbought and oversold conditions in the market, indicating potential reversal points and opportunities for profitable trades.
The stochastic oscillator consists of two lines, %K and %D, which fluctuate between 0 and 100. Traders primarily focus on the %K line, as it is more sensitive and provides timely signals. The %D line, on the other hand, serves as a moving average of the %K line, offering smoother signals.
When the %K line crosses above the %D line and both lines are below the overbought level of 80, it suggests a buy signal. Conversely, when the %K line crosses below the %D line and both lines are above the oversold level of 20, it indicates a sell signal. These crossovers help traders capitalize on potential market reversals and generate profits.
Additionally, traders use the stochastic oscillator to identify bullish and bearish divergences. A bullish divergence occurs when the price of a cryptocurrency forms a lower low, while the stochastic oscillator prints a higher low. This indicates potential upward momentum and an opportunity to enter a long position. Conversely, a bearish divergence occurs when the price forms a higher high, but the stochastic oscillator creates a lower high. This signals a potential downward movement and a chance to open a short position.
- The stochastic oscillator helps traders identify overbought and oversold conditions.
- Traders primarily focus on the %K line for timely signals.
- Crossovers between %K and %D lines indicate potential buy or sell signals.
- Bullish and bearish divergences can serve as entry points for long or short positions.
Harnessing the Power of the Parabolic SAR Indicator in Cryptocurrency Scalping
The Parabolic SAR (Stop And Reverse) indicator is a popular tool used in cryptocurrency scalping to identify potential entry and exit points. This indicator is based on the idea that trends tend to accelerate over time.
When the Parabolic SAR dots are located below the price, it indicates a bullish trend, suggesting that it may be a good time to enter a long position. Conversely, when the dots are above the price, it indicates a bearish trend, suggesting a potential opportunity to enter a short position.
The Parabolic SAR is particularly useful in volatile cryptocurrency markets, where prices can change rapidly. By following the direction indicated by the dots, traders can potentially profit from these short-term price movements.
It’s important to note that the Parabolic SAR is not designed to provide exact market timings. Instead, it helps to identify overall trends and potential reversal points. As with any indicator, it’s essential to combine it with other tools and indicators to increase the accuracy of your trading strategy.
Leveraging the Relative Strength Index (RSI) for Effective Crypto Scalping
The Relative Strength Index (RSI) is a vital tool for cryptocurrency traders looking to succeed in scalping. This oscillator momentum indicator compares the magnitude and speed of price movements, offering insights into overbought and oversold conditions.
When utilizing the RSI for effective scalping, it’s important to understand its key components. The RSI value ranges from 0 to 100, with readings above 70 suggesting potential overbought conditions and readings below 30 indicating potential oversold conditions.
Scalpers can leverage the RSI to identify potential trend reversals and divergence between price movements and momentum. For instance, if the RSI is above 50, it signifies a bullish trend, while a reading below 50 suggests a bearish momentum.
By using RSI alongside other indicators like moving averages and support/resistance levels, traders can enhance their decision-making process and identify optimal entry and exit points for scalping opportunities.
Support and Resistance Levels
Support and resistance levels play a vital role in refining your cryptocurrency scalping strategy. These levels represent key price thresholds at which the market tends to show significant buying or selling pressure. By identifying these levels, you can make more informed decisions regarding your entry and exit points, increasing the profitability of your scalping trades.
To effectively utilize support and resistance levels, you need to understand how they are formed. Support levels are price levels where buying pressure tends to outweigh selling pressure, causing the price to bounce back up. While resistance levels are price levels at which selling pressure overpowers buying pressure, leading to the price being pushed down.
Here are some key techniques to incorporate support and resistance levels into your cryptocurrency scalping strategy:
- Identifying Support and Resistance Zones: Start by analyzing price charts to identify significant areas where support or resistance has formed. Look for clusters of price points that have acted as barriers in the past. These zones can provide valuable insights into future price movements.
- Confirming Breakouts: Support or resistance levels can sometimes be breached, leading to potential breakouts. When a breakout occurs, it suggests a shift in market sentiment and can present trading opportunities. However, it is essential to wait for confirmation of the breakout before entering a trade.
- Using Trendlines: Trendlines are useful tools for identifying potential support and resistance levels. By drawing trendlines connecting significant swing lows or highs, you can visualize the overall trend and potential areas of support or resistance within that trend.
- Considering Timeframes: Support and resistance levels can vary depending on the timeframe you are analyzing. A level that appears significant on a shorter timeframe may not hold as much weight on a longer timeframe. Consider multiple timeframes to get a comprehensive view of support and resistance levels.
- Using Indicators: Various technical indicators, such as moving averages and Fibonacci retracement levels, can complement your analysis of support and resistance. These indicators can help confirm the validity of key levels and provide additional insights into potential price reversals or continuations.
Remember, support and resistance levels are not fixed but rather dynamic, shifting as market conditions change. Regularly reassess these levels to stay in tune with the evolving market trends. By incorporating support and resistance levels into your cryptocurrency scalping strategy, you can enhance your ability to identify optimal entry and exit points, improving your chances of success in the fast-paced world of scalping.
Which Indicator Is Best for Scalping Cryptocurrencies – Conclusion
Effective indicators play a crucial role in maximizing profits when scalping cryptocurrencies. By understanding and utilizing indicators such as moving averages, MACD, RSI, stochastic oscillator, Parabolic SAR, and support/resistance levels, traders can make informed decisions and enhance their scalping strategies.
Whether you’re a seasoned trader or just starting out, incorporating these indicators into your trading arsenal can help you navigate the cryptocurrency markets with confidence and achieve consistent profitability. Stay informed, stay disciplined, and keep refining your strategy to stay ahead in the dynamic world of cryptocurrency scalping.
To learn more about scalping strategies, check out CScalp TV, where we share a plethora of educational videos to help you improve your trading approach over time. We also encourage you to join the growing community on our Discord channel and find like-minded traders to share ideas with.
Related article: Bybit Scalping: Boost Your Crypto Trading Profits with Effective Strategies
FAQs: Frequently Asked Questions About Best Indicators for Scalping Cryptocurrencies
What Indicators Are Best for Cryptocurrency Scalping?
Moving averages, such as the Simple Moving Average (SMA) and the Exponential Moving Average (EMA), can help identify trends and determine entry and exit points. The MACD indicator measures momentum and can be useful for identifying potential trend reversals. The Stochastic Oscillator is another valuable tool for assessing overbought and oversold conditions. Additionally, the Parabolic SAR indicator can help traders determine stop loss levels. Lastly, the Relative Strength Index (RSI) is great for identifying overbought and oversold conditions and potential trend reversals.
How Do I Use Moving Averages in Crypto Scalping?
When using moving averages for cryptocurrency scalping, the Simple Moving Average (SMA) and the Exponential Moving Average (EMA) can provide valuable insights. The SMA helps smooth out price fluctuations and identify support and resistance levels. Traders often look for price crossovers with the SMA as potential entry or exit points. On the other hand, the EMA gives more weight to recent price data, making it more responsive to price changes. It can be used to identify short-term trends and generate trading signals.
What Is the Role of the MACD Indicator in Cryptocurrency Scalping?
The MACD (Moving Average Convergence Divergence) indicator is a versatile tool for cryptocurrency scalping. It consists of two lines – the MACD line and the signal line – as well as a histogram. Traders look for crossovers between the MACD line and the signal line, as well as divergences between the MACD line and the price chart. These crossovers and divergences can indicate potential buy or sell signals, helping traders identify trend reversals or continuations.
How Can the Stochastic Oscillator Be Useful in Cryptocurrency Scalping?
The Stochastic Oscillator is a momentum indicator that helps identify overbought and oversold conditions in the market. Traders use it to determine potential trend reversals and take advantage of price fluctuations. When the indicator reaches high levels (above 80), it suggests that the asset may be overbought and due for a downward correction. Conversely, when it reaches low levels (below 20), it indicates that the asset may be oversold and due for an upward correction.
What Is the Significance of the Parabolic SAR Indicator in Cryptocurrency Scalping?
The Parabolic SAR (Stop and Reverse) indicator is useful for setting Stop-Loss levels in cryptocurrency scalping. It provides dynamic support and resistance levels that move with the price action. When the price is below the SAR dots, it suggests a bullish trend, while a price above the dots indicates a bearish trend. Traders can adjust their Stop-Loss levels accordingly, ensuring protection for their positions while maximizing profit potential.
How Does the Relative Strength Index (RSI) Contribute to Effective Cryptocurrency Scalping?
The Relative Strength Index (RSI) is a popular oscillator that measures the speed and magnitude of price movements. It helps identify overbought and oversold conditions, indicating potential trend reversals. When the RSI is above 70, it suggests the asset may be overbought and due for a downward correction. Conversely, when the RSI is below 30, it indicates the asset may be oversold and due for an upward correction. Traders can use this information to make informed scalping decisions.
How Can I Fine-Tune My Cryptocurrency Scalping Strategy With Support and Resistance Levels?
Support and resistance levels are key elements of any trading strategy, including cryptocurrency scalping. Support levels represent price levels where buying pressure is expected, preventing the price from declining further. Resistance levels, on the other hand, are price levels where selling pressure is expected, preventing the price from rising further. By identifying these levels, traders can set appropriate entry and exit points, increasing the probability of successful trades.
Join the CScalp Trading Community
Join our official trader's chat. Here you can communicate with other scalpers, find trading soulmates and discuss the market. We also have an exclusive chat for crypto traders!
Don't forget to subscribe to our official CScalp news channel, use trading signals and get to know our bot.
If you have any questions, just contact our platform's support via Telegram at @CScalp_support_bot. We will respond in a matter of seconds.
You can also visit our Discord channel and subscribe to the CScalp TV YouTube channel.
JOIN OUR CHAT