
Moving Average Indicator: Everything You Need to Know
Having access to the best indicators for day trading is crucial as they play a pivotal role in deciphering market trends and guiding trading strategies. Among these tools, the Moving Average indicator holds a prominent position. This article delves into the essence of the Moving Average, exploring its significance, applications, and various types. Whether you’re new to trading or an experienced investor, grasping the MA indicator can enhance your day trading skills significantly.
Attention! This article is for informational purposes only and does not contain recommendations or calls to action.
The review has been prepared by the CScalp terminal team. You can get CScalp by leaving your e-mail in the form below.
What is the Moving Average Indicator?
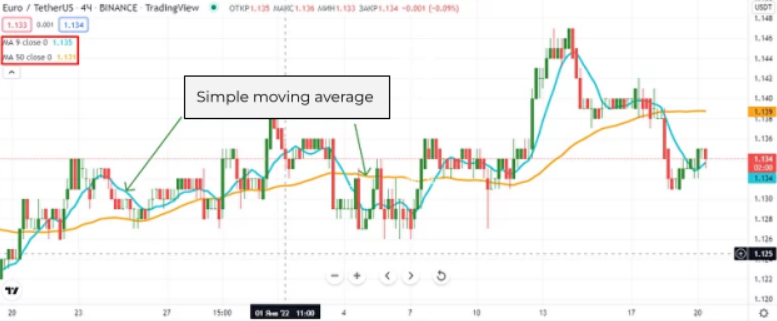
Moving Average (MA) is an indicator that serves as a cornerstone of technical analysis. Its fundamental purpose lies in smoothing out the price data by establishing a constantly updated average price. By calculating this average, the erratic impact of short-term price fluctuations within a specified time frame is mitigated. The Moving Average can be broadly categorized into two main types: the Simple Moving Average (SMA) and the Exponential Moving Average (EMA).
The Moving Average stands as the average price of an asset over a specific period of time. Represented as a curved line that tracks price movements, the MA simplifies price analysis, providing traders with a convenient tool to identify trends. It’s important to note that the Moving Average is a lagging indicator, meaning it provides insights based on historical data.
As such, it finds its most valuable application in day trading and swing trading strategies, facilitating informed decision-making for these approaches. However, its responsiveness may not be suitable for scalping, a trading style that demands rapid reactions to quick price changes.

Why Use the Moving Average Indicator?
The Moving Average indicator emerges as a vital tool for filtering market noise. Its significance lies in two key functions that contribute to a deeper understanding of asset price behavior.
Identifying Trend Direction
One of the primary functions of the Moving Average is to identify the direction of a price trend. By observing the movement of the Moving Average, traders gain valuable insights into the overall price trend. A rising Moving Average signifies an uptrend or recent upward movement in the price, while a descending Moving Average points to a downtrend. In cases where the Moving Average appears relatively horizontal, it suggests a sideways or ranging market.
Determining Support and Resistance
Another critical role of the Moving Average is in determining dynamic support and resistance levels. During an uptrend, specific Moving Averages like the 50-day, 100-day, or 200-day variants can serve as robust support levels. These Moving Averages prevent the price from experiencing steep declines. Conversely, in a downtrend, a Moving Average may act as resistance, inhibiting the price’s upward movement.
However, it’s essential to note that price behavior may not always perfectly align with the Moving Average. Price movements might slightly exceed or stall and reverse before reaching the average, underscoring the dynamic nature of financial markets.
The dual function of Moving Averages serves as a foundation for technical analysis in financial markets. Positioned as trend-following or lagging indicators, they leverage historical price data to uncover potential movements.
The period length of the Moving Average directly influences its responsiveness. For instance, a 200-day Moving Average, encompassing extensive price history, introduces more lag compared to a 20-day variant. The 50-day and 200-day Moving Averages, revered by both traders and investors, play a pivotal role in signaling potential opportunities.
Investors can tailor their Moving Average preferences to align with trading objectives. Shorter Moving Average cater to short-term trading strategies, providing insights into swift market changes. Conversely, longer-term Moving Averages align with the strategic goals of investors who focus on the broader market trends.
Understanding these two fundamental functions of the Moving Average indicator empowers traders and investors to make informed decisions, navigate market dynamics, and seize opportunities that align with their chosen trading strategies.
Types of Moving Average Indicators
Simple Moving Average (SMA)
This foundational indicator involves calculating the arithmetic mean of a set of values over a specific period. The formula for SMA entails summing up the prices and dividing them by the number of prices in the set. While simple, this Moving Average type provides valuable insights into the market’s overall trajectory.
Exponential Moving Average (EMA)
The EMA carries the objective of assigning higher significance to recent prices, enhancing its responsiveness to emerging trends. Calculated based on a preceding SMA, the EMA incorporates a smoothing factor for weighing recent prices more heavily. This increased responsiveness makes the EMA a preferred choice for traders seeking quicker insights into market changes.
Another widely used indicator is the one that helps to predict price movements in relation to the behavior of two Moving Averages. To learn more about how to use the MACD indicator in trading, we recommend you to visit our recent article on the subject.
Moving Average Formula
For a Simple Moving Average (SMA), the calculation involves adding the closing prices of all trading days in a given period and then dividing by the total number of days. This yields the Moving Average for one day. To calculate subsequent days’ averages, the earliest day of the previous period is excluded, and the most recent day is included. This process results in a Simple Moving Average (SMA) that reflects a broader average trend over time.
Calculating an Exponential Moving Average (EMA) involves a method that emphasizes recent prices and responsiveness to market changes. The EMA formula takes into account a smoothed constant, denoted as α, which ranges between 0 and 1. The formula for α is [2/(number of selected periods + 1)].
The EMA at a specific time, denoted as EMAt, is calculated using this formula: EMAt = α * current price + (1 – α) * EMA t-1. Here, EMA t-1 represents the EMA for the previous period.
This calculation highlights the interconnected nature of EMAs over time. To calculate the EMA at a particular point, knowledge of previous EMAs is necessary. The daily EMA, for example, relies on the previous day’s EMA, which is in turn linked to the EMA from the day before, creating a chain of calculations.
Mastering the Moving Average Indicator
The Moving Average indicator emerges as a guiding light for traders and investors navigating the complexities of financial markets. Its ability to smoothen price data, identify trends, and provide support and resistance levels offers unparalleled insights into market dynamics. Whether you’re an enthusiast or an expert, mastering the Moving Average indicator can empower you to make well-informed decisions in the ever-evolving realm of trading.
Related article: LuxAlgo TradingView Indicators Are Set to Power Your Trading
Join the CScalp Trading Community
Join our official trader's chat. Here you can communicate with other scalpers, find trading soulmates and discuss the market. We also have an exclusive chat for crypto traders!
Don't forget to subscribe to our official CScalp news channel, use trading signals and get to know our bot.
If you have any questions, just contact our platform's support via Telegram at @CScalp_support_bot. We will respond in a matter of seconds.
You can also visit our Discord channel and subscribe to the CScalp TV YouTube channel.
JOIN OUR CHAT