
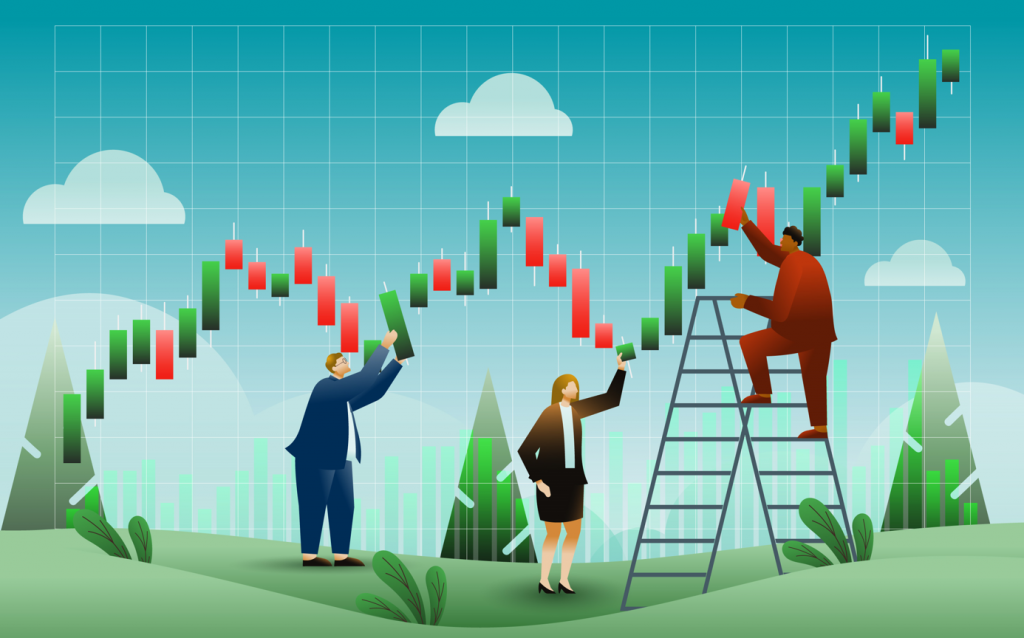
Psychology of Candlesticks: Unveiling the Secrets of Cryptocurrency Trading
CScalp delves into the psychology of candlesticks and explores its significance in market analysis. From Doji’s to Hammer and Engulfing patterns, we will explore their impact on trading psychology and discuss the importance of volume as an indicator and the role of location in the formation of candlestick patterns.
Attention! This article is for informational purposes only and does not contain recommendations or calls to action.
The review has been prepared by the CScalp terminal team. You can get CScalp by leaving your e-mail in the form below.
Understanding Candlestick Charts in Cryptocurrency Trading
Understanding candlestick charts is essential for accurate market analysis. Patterns they create provide valuable insights into price movements and market psychology. Let’s explore the basics of candlestick charts, the different types of candlestick patterns, as well as the importance of location in candlestick pattern formation.
To practice candlestick trading, try the CScalp platform by leaving your email in the form above. With the free professional terminal, you will be able to connect to an exchange and place orders with one click, automatically set Stop-Loss and Take-Profit targets, as well as manage your risks.
Psychology of Candlesticks Basics
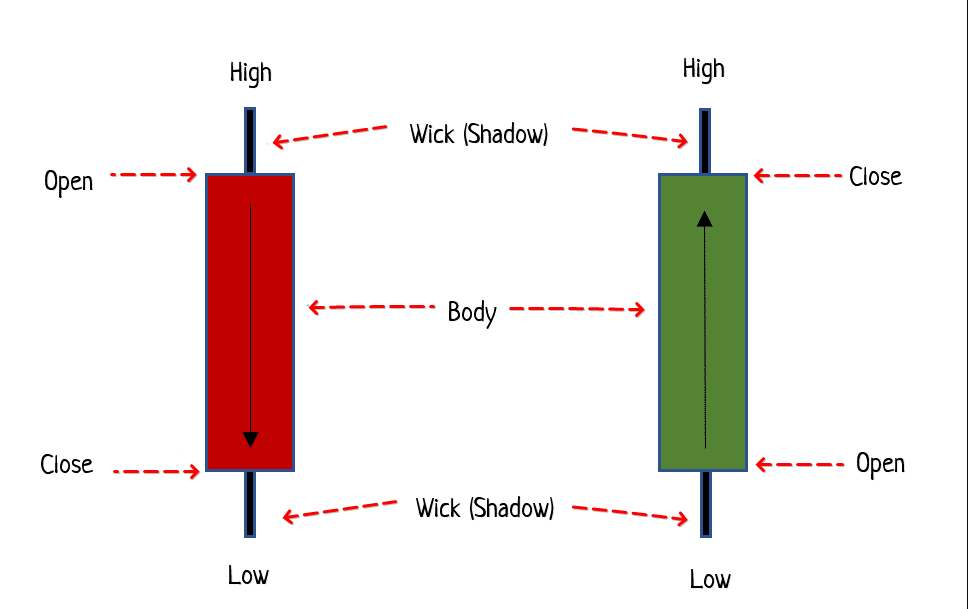
Candlestick charts are visual representations of price movements over a specific period. Each candlestick consists of a body and two wicks (shadows). The body represents the price range between the opening and closing prices, while the wicks indicate the highest and lowest prices reached during the period. By analyzing the patterns formed by candlesticks, traders can gain insights into market sentiment and potential trend reversals.

Different Types of Candlestick Patterns
There are various types of candlestick patterns that traders need to learn about. These patterns provide valuable information about market behavior and potential trading opportunities. Some examples include Doji’s, Hammer’s, Engulfing patterns, and Harami patterns. Each pattern has its unique psychology and implications for market direction.
Doji’s and Their Significance in Trading
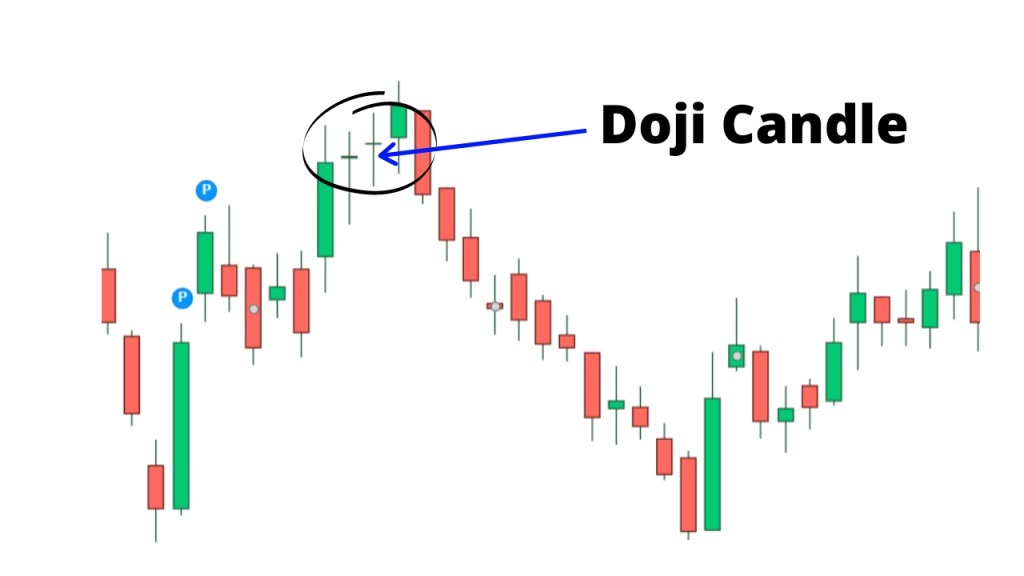
Doji’s are candlestick patterns characterized by a small body with wicks on both ends, indicating that the opening and closing prices are almost the same. They represent indecision and can signal potential trend reversals. Traders need to consider the market context and volume when interpreting Doji patterns.
Hammer’s Role in Market Analysis
Hammer patterns have a small body and a long lower wick. They indicate that buyers have stepped in to reverse a downtrend, potentially signaling a bullish reversal. Traders should pay attention to the volume and the location of the hammer pattern within the overall market trend for accurate analysis.

Engulfing Patterns: How to Interpret Them
Engulfing patterns occur when a candlestick fully engulfs the previous candlestick. They indicate a shift in market sentiment and potential trend reversals. Traders need to consider the size of the engulfing pattern and its location within the market trend for accurate interpretation.

Exploring Harami Patterns and Their Effects on the Market
Harami patterns consist of two candlesticks, where the first candlestick has a large body and the second candlestick is contained within the body of the first. They indicate a potential trend reversal. Traders need to consider the size and location of the harami pattern within the overall market trend for accurate analysis.

Other Important Candlestick Patterns and Their Psychology
There are several other important candlestick patterns, such as shooting stars, spinning tops, and Doji variants like dragonfly, gravestone, and long-legged Doji. Each pattern has its unique psychology and implications for market behavior.
The Role of Volume as an Indicator in Candlestick Analysis
Volume is an essential factor in interpreting candlestick patterns. It provides insights into the strength of price movements and market participation. High volume during specific candlestick patterns confirms their significance, while low volume may indicate indecision or lack of market interest. Traders should consider volume in conjunction with candlestick patterns for accurate analysis.
Importance of Location in Candlestick Patterns Formation
The location of a candlestick pattern within the overall market trend is crucial for accurate analysis. Patterns formed near key support or resistance levels carry more weight and have a higher probability of being reliable. Traders should pay attention to the location of candlestick patterns to make informed trading decisions.
Analyzing Single Candlestick Patterns in Cryptocurrency Trading
The psychology and interpretation of individual candlestick patterns play a pivotal role in cryptocurrency trading. By understanding these patterns, traders can gain valuable insights into market behavior and make informed decisions.
Significance and Interpretation of Spinning Tops
Spinning tops are candlestick patterns characterized by small bodies and long upper and lower shadows. These patterns indicate a balance between buyers and sellers, leading to indecisiveness in the market. Traders examine the length of the shadows and the overall size of the candlestick to identify potential market reversals or continuation patterns.
Dragonfly, Gravestone, and Long-legged Doji: Insights into Market Behavior
Dragonfly, gravestone, and long-legged Doji candlestick patterns also provide insights into market behavior. Dragonfly Doji indicates potential bullish reversals, often found at the bottom of a downtrend. Gravestone Doji suggests bearish reversals, typically observed at the top of an uptrend. Long-legged Doji represents high market volatility and uncertainty. Traders analyze these patterns to anticipate trend shifts and plan their trading strategies.
Exploring Candlestick Patterns Formed by Two Candles
Understanding the Psychology of Harami Patterns
Harami patterns consist of a small candlestick within the range of the previous larger candlestick. This pattern indicates a potential trend reversal. The psychology behind Harami patterns suggests a shift in market sentiment, with buyers or sellers losing control. Traders analyze the body size and location of the small candlestick relative to the larger one to assess its significance.
Hammer Patterns: A Closer Look at Market Reversals
Hammer patterns form when the opening and closing prices are near the high, with a long lower shadow. This pattern signifies a potential bullish reversal. Traders interpret the psychology behind hammer patterns as a rejection of lower prices and a potential shift in market sentiment. The length of the lower shadow is a key factor in determining the pattern’s strength and reliability.
Dark Cloud Cover and Piercing Line Patterns: Analyzing Price Movements
Dark Cloud Cover and Piercing Line are two candlestick patterns that provide insights into potential reversals. Dark Cloud Cover forms when a bearish candlestick engulfs the previous bullish one, indicating a bearish reversal. Conversely, a Piercing Line occurs when a bullish candlestick engulfs the previous bearish one, suggesting a bullish reversal.
Engulfing Patterns and Their Impact on Trading Strategies
Engulfing patterns are characterized by a larger candlestick completely engulfing the previous smaller one. This pattern signals a potential trend reversal. Traders delve into the psychology behind engulfing patterns, which indicates a shift in control from buyers to sellers or vice versa. By considering the size and location of the engulfing candlestick, traders can make informed decisions and adjust their trading strategies.
Analyzing Market Trends with Three Candlestick Patterns
Stars Patterns: Insights into Market Direction
Stars patterns are three candlestick formations that provide insights into market direction. They consist of a small candle with a narrow range sandwiched between two larger candles. A bullish star pattern indicates a potential trend reversal from a downtrend to an uptrend, while a bearish star pattern suggests a reversal from an uptrend to a downtrend.
Psychology Behind Candlesticks and Chart Patterns
The psychology behind candlesticks and chart patterns plays an important role in traders’ decision-making processes. By understanding the influence that candlesticks have on market behavior, traders can gain valuable insights into price movements and make more informed trading decisions.
Influence of Candlesticks on Traders’ Decision-Making Process
Candlestick patterns evoke emotional responses among traders, impacting their decision-making process. For example, a long bullish candlestick may instill confidence and lead to buying activity, while a bearish engulfing pattern may induce fear and prompt selling. Recognizing these psychological reactions can help traders anticipate market sentiment and adjust their strategies accordingly.
Learn more: Emotional Control in Trading: Master Your Emotions for Profitable Cryptocurrency Trading
Understanding the Significance of Price Levels: PDL, PDH, Support, and Resistance
Price levels such as Previous Day Low (PDL), Previous Day High (PDH), support, and resistance are central to candlestick analysis. Traders closely monitor these levels as they can act as psychological barriers that influence market behavior. Breakouts above resistance or below support levels can signal significant shifts in market sentiment, providing traders with potential opportunities to make money.
Traps and Misconceptions in Interpreting Candlestick Patterns
Interpreting candlestick patterns requires caution, as traders can fall into traps and misconceptions. For instance, a bullish engulfing pattern may seem like a strong buy signal, but it could be a trap set by smart money to lure in retail traders before a reversal. Understanding common pitfalls and being aware of possible false signals can help traders make more accurate interpretations.
Using Candlestick Charts for Technical Analysis in Cryptocurrency Trading
The use of candlestick charts is highly advantageous in technical analysis when it comes to cryptocurrency trading. Unlike conventional line charts, Japanese candlesticks provide more detailed information about market behavior.
Advantages of Candlestick Charts over Conventional Line Charts
Candlestick charts offer numerous advantages over conventional line charts in cryptocurrency trading. They provide a visual representation of price movements, showcasing not only the opening and closing prices but also the high and low prices within a given time period.
Analyzing Strength Ratio, Body Size, Shadows, and Position for Market Insights
Examining the strength ratio, body size, shadows, and position of candlestick patterns can provide valuable insights into market behavior. By comparing the length and thickness of the candlestick body to its shadows, traders can assess the dominance of buyers or sellers in the market. Additionally, the position of the body relative to the overall range can indicate if prices are closing near the high or low, hinting at potential reversals or continuation of trends.
Evaluating Buyer-Seller Dynamics and Market Behavior
An in-depth analysis of candlestick patterns enables traders to evaluate the dynamics between buyers and sellers, helping them gauge market sentiment. By identifying patterns such as Doji formations or long-legged Doji, traders can recognize indecision in the market or potential trend reversals. Moreover, understanding market behavior through candlestick charts allows traders to adjust their strategies accordingly, maximizing their chances of success.
Incorporating Candlestick Patterns into Trading Strategies
Day Trading Strategies Using Candlestick Patterns
Day trading in cryptocurrency markets requires a deep understanding of candlestick patterns and their implications. By incorporating candlestick analysis into your day trading strategies, you can gain valuable insights into market dynamics and make informed trading decisions.
One effective strategy is to focus on short-term trends and use candlestick patterns as entry and exit signals. For example, identifying bullish engulfing patterns can signal potential buying opportunities, while bearish engulfing patterns may indicate a time to sell or short. By combining these patterns with other technical indicators, such as support and resistance levels, volume, and trendlines, you can increase the accuracy of your day trading strategies.
Importance of Post-Pattern Formation Analysis
While identifying candlestick patterns is essential, it is equally important to analyze the price action and market behavior that follows the pattern formation. Traders should pay close attention to the confirmation and validity of the patterns before executing trades.
Post-pattern analysis involves monitoring how the price reacts after a specific pattern emerges. For example, a bullish hammer pattern followed by a strong upward price momentum confirms the pattern’s reliability, indicating a potential bullish trend. Similarly, a bearish engulfing pattern followed by a downtrend confirms the pattern’s validity, suggesting a potential bearish move.
Reliability and Importance of Candlestick Patterns in Market Analysis
Candlestick patterns play a crucial role in market analysis, as they provide valuable insights into market sentiment and potential price reversals. Understanding the reliability and importance of different patterns can significantly improve your trading decisions.
Some candlestick patterns, such as Doji’s or hammer patterns, are known for their higher reliability in signaling trend reversals. On the other hand, patterns like spinning tops or engulfing patterns may offer insights into short-term price fluctuations. By studying historical data and backtesting, traders can gain a better understanding of the reliability of various candlestick patterns in different market conditions.
Considering the importance of candlestick patterns is also essential when formulating trading strategies. Traders can use these patterns to determine entry and exit points, set stop-loss and take-profit levels, and manage risk effectively.
Enhancing Technical Analysis Skills with the Psychology of Candlesticks
Exploration of Psychological Factors in Candlestick Analysis
Understanding the psychology of candlesticks is essential for successful technical analysis in cryptocurrency trading. By delving into the psychological factors that drive market behavior, traders can gain valuable insights into the mindset of buyers and sellers. The interpretation of candlestick patterns requires an understanding of human emotions and reactions, such as fear, greed, and uncertainty. Traders need to consider how these emotions manifest in different candlestick patterns and how they influence market movements.
Improving Market Understanding and Trading Strategies
By incorporating the psychology of candlesticks into their technical analysis, traders can enhance their market understanding and develop more effective trading strategies. Recognizing the psychological factors at play allows traders to anticipate potential market reversals, identify trend continuations, and determine optimal entry and exit points. Additionally, understanding the impact of psychological biases, such as confirmation bias and herding behavior, helps traders make more objective and rational decisions.
Psychology of Candlesticks – Conclusion
The psychology of candlesticks plays an important role in enhancing technical analysis skills in cryptocurrency trading. By exploring factors that influence market behavior and incorporating this understanding into trading strategies, you can gain a competitive edge and improve your overall success in the dynamic crypto market.
To further enrich your experience, we invite you to join our Discord server. Your insights, questions, and discussions will be a valuable addition to our growing community of traders.
Related article: Trading Psychology Course: Strategies to Master Your Emotions
Join the CScalp Trading Community
Join our official trader's chat. Here you can communicate with other scalpers, find trading soulmates and discuss the market. We also have an exclusive chat for crypto traders!
Don't forget to subscribe to our official CScalp news channel, use trading signals and get to know our bot.
If you have any questions, just contact our platform's support via Telegram at @CScalp_support_bot. We will respond in a matter of seconds.
You can also visit our Discord channel and subscribe to the CScalp TV YouTube channel.
JOIN OUR CHAT