CANDLESTICK CHART PATTERNS TRADING CHEAT SHEET [CRYPTO AND FOREX]
Chart patterns are characteristic, recurring areas on the price chart, they are also called technical analysis figures or technical figures.
Technical analysis patterns are formed using the simplest tools of graphical analysis, namely levels, resistance, and support lines. This is the first thing every trader should keep in mind.
To help you navigate easily in technical patterns, we have prepared a list of basic chart patterns and will tell you how you can find and use them to your advantage when trading in the market.
The list is divided into trend reversal, continuous, and indefinite patterns.
Attention! This article is for informational purposes only and does not contain recommendations or calls to action.
The review has been prepared by the CScalp terminal team. You can get CScalp by leaving your e-mail in the form below.
Reversal patterns
These patterns are usually formed at the local maximums and minimums of the price chart during an ascending or descending trend. They show that the current trend has weakened and either correction or reversal and change to the opposite trend is expected.
The main reversal patterns are head and shoulders, inverted head and shoulders, double top, double bottom, triple top, and triple bottom.
Head and shoulders
The pattern called “Head and Shoulders” is a reversal pattern and can be used to enter a “bearish” position after a “bullish” trend.
How to draw a head and shoulders pattern? It consists of 3 vertices, the maximum of which is in the middle and is called the head. The neck is the line connecting the two points. The height of the last peak may be higher than the first one, but not higher than the head. In other words, the price tried to reach a higher maximum but failed. The closer the 2 outer tops are to the same price, the more accurate the pattern.

Head & shoulders Pattern
How to read the head and shoulders pattern? A head-and-shoulders pattern occurs when the price starts to rise, marking a bullish trend, and reaches a new high. However, the price increase is short-lived and prices begin to fall. This fall in prices lasts briefly, when the bullish trend returns and prices rise, reaching new high levels. After reaching the highest level, prices start falling again, marking a bearish trend. Prices rise again when the bullish trend returns. This time the price fails to reach the previous high.
How do I trade head and shoulders patterns? You should watch for partial or near-complete patterns, but trade when the pattern penetrates the neckline. Be patient and plan your trades by writing down your entry, stops, and take-profits so you are ready to act when the neckline is penetrated.
Inverse head and shoulders
The inverse head and shoulders pattern can also form in the opposite direction. A bullish version of the pattern, called “head and shoulders down” or “inverse head and shoulders,” is formed at the bottom of a downtrend and means that an existing bearish trend is likely to reverse and the price will go up.
How to draw an inverse head and shoulders pattern? The inverse head and shoulders pattern is formed on the lows of the price chart during the downtrend. That is, the “head” peak and “shoulders” peaks are located below the level of the neck, but not above, as for the standard pattern of head and shoulders. This pattern of technical analysis is considered to be fully formed only after the price closes above the baseline of the pattern.
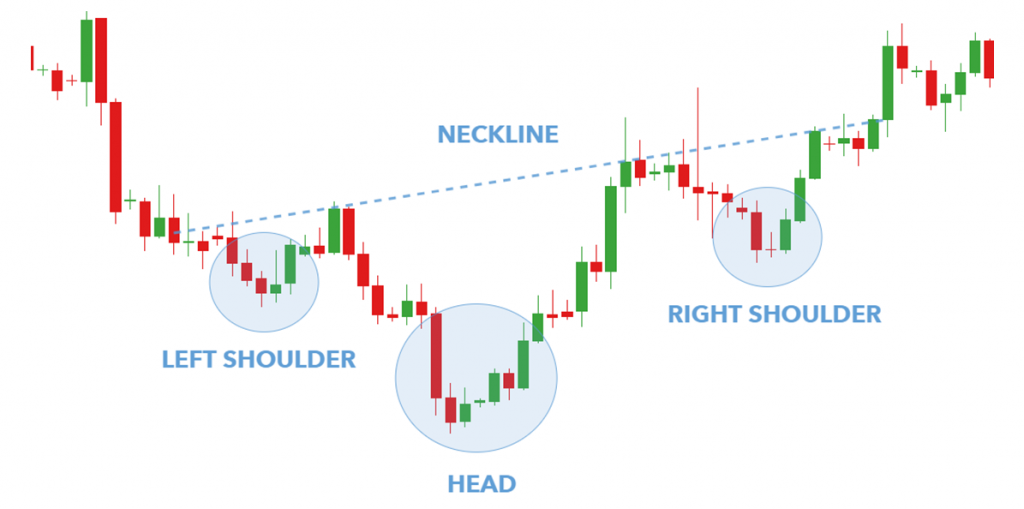
Inverse head & shoulders
How to read the inverse head and shoulders pattern? After the top of the left shoulder is formed, the price goes up, completing the first figure. It then falls to a new low followed by a recovery of the move-up, creating a head. A downward corrective reaction occurs and the right shoulder begins to form and then the price moves sharply up again.
A neckline is then formed, which serves as a resistance line. Once the second shoulder is formed, the price will make a final rally, penetrating the neckline and indicating the end of the inverse head and shoulders pattern and the reversal of the bearish trend.
How to trade the inverse head and shoulders pattern? Once you have identified an inverse head and shoulders pattern in a downtrend and the right shoulder has been completed, you can look to enter a buy order once the price breaks through the neckline. Wait for a candle to close above the neckline before entering the market to avoid a false breakout.
Double top and double bottom
Reversal patterns are similar in meaning to the head and shoulders and inverse head and shoulders patterns described above. These technical analysis patterns are formed after an upward or downward movement, signalling the end of the trend and the forthcoming correction or reversal.
Double top
The double top pattern is formed after the upward movement at the local maximum of the chart.
How to draw a double-top pattern? The double top pattern resembles the letter “M”.
As a result of an uptrend, prices first establish a new maximum, and in most cases trading volume increases, then prices roll back from the maximum and reach a support level, while volume continues to fall.
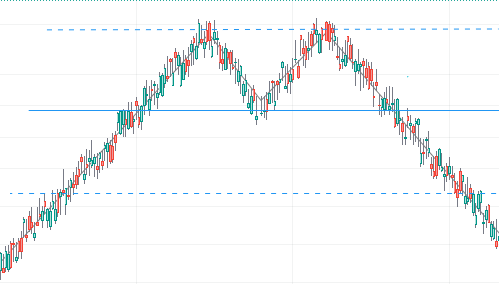
Double top pattern
How to read a double-top pattern? The double-top pattern in the stock market indicates a potential change from an uptrend to a downtrend.
To determine whether or not a double top has definitely formed, traders can analyze other elements:
- A second consecutive high is set at the same level as the previous high, after which the price moves downward;
- Volume. Trading volume is usually high when a second top is formed;
- Breakout support. The price breaks the support downwards after the formation of the second top and the subsequent pullback.
How to trade a double-top pattern? The first way to trade this pattern is to look for the neckline that is marked on the chart below. Once the price breaks through the neckline, you can then enter the market with a sell order.
The second way to trade is to wait for the price to trade below the neckline (broken support) and then look to place a sell order on the retest of the neckline as resistance (broken support now becomes resistance).
Double bottom
The double bottom pattern is a bullish reversal pattern that occurs at the bottom of a downtrend and signals that the sellers who have so far controlled the price action are losing momentum.
How to draw a double-bottom pattern? The double-bottom pattern implies the achievement of two relatively low points on the chart, which are approximately on the same horizontal price level. This pattern signals a likely bullish reversal. There is a noticeable strengthening of the price level of support between the two lower points.
On the chart, the double bottom is formed at the end of a downtrend and resembles the letter “W”.
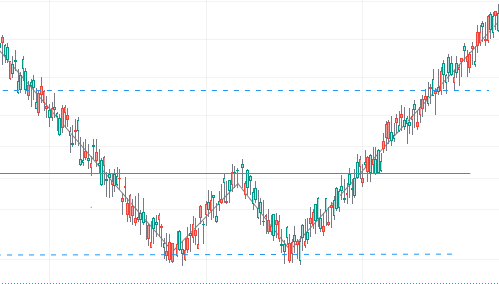
Double bottom pattern
How to read a double bottom pattern? This pattern always appears after a long downtrend. The formation of the letter W indicates that an uptrend begins. Therefore in this case you can safely bet on the rise (and place the stop loss somewhere below the support level).
To determine whether or not a double bottom has definitely formed, traders can analyze other elements:
- the shape of the pattern should resemble the Latin letter W;
- after the first touch of the low, it should bounce back by about 15-20%. Then it should start falling again on low volumes (this is very important);
- if you see too much volume in the decline, there’s a chance the price won’t rebound a second time but will break the support level;
- after the second touch and the beginning of the bounce, volumes should be increased. If they don’t, it’s probably not a double-bottom pattern, but just a price consolidation;
- the pattern is considered to be complete only when the price breaks the neckline, i.e. resistance level.
How to trade a double bottom pattern? In the case of trading during the double-bottom pattern, most traders enter the market immediately after the price breaks above the notch line, but you can try a different approach.
Instead of waiting for a clear breakout, you can quietly watch the market – price could potentially turn down immediately after breaking above the notch line. However, you need bullish signs, not swings.
Triple top and triple bottom
Triple top
A triple-top chart pattern is a bearish reversal chart pattern that is formed after an uptrend.
How to draw a triple-top pattern? This pattern is formed from three consecutive tops, the support line (neckline) and the resistance line. It is often compared to the head and shoulders pattern, but there is a difference between them – the triple top pattern has the height of all three tops on the resistance line and is approximately equal to each other.
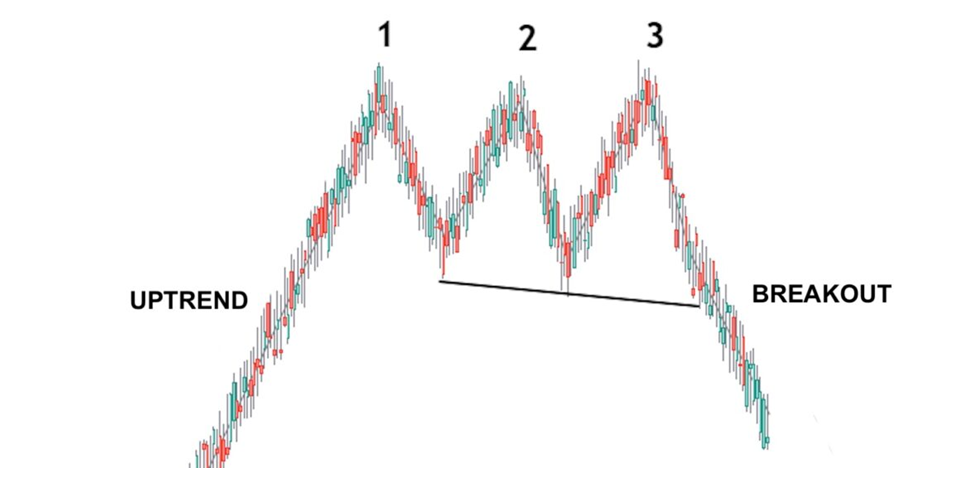
Triple top pattern
How to read the triple-top pattern? Technically, a triple-top pattern shows us that the price is unable to penetrate the area of the peaks. Translated into real-life events, it means that, after multiple attempts, the asset is unable to find many buyers in that price range.
As the price falls, it puts pressure on all those traders who bought during the pattern to start selling. If the price can’t rise above resistance there is limited profit potential in holding onto it. As the price falls below the swing lows of the pattern, selling may escalate as former buyers exit losing long positions and new traders jump into short positions. This is the psychology of the pattern, and what helps fuel the selloff after the pattern completes.
How to trade the triple-top pattern? There are two ways to trade in this pattern – to work on a breakout or a bounce.
The first variant – we wait for the moment when the price touches a maximum (resistance level) for the third time. After that the quotes go down to the support level and, as a rule, if the triple top is formed, a breakout takes place.
This breakdown of support can be used as a signal to act. At this point, trades are opened to sell in the expectation that the downtrend will develop, at least on the range of the difference between support and resistance inside the pattern.
It is also possible to trade more conservatively – it is necessary to wait not only for the breakdown of support but also for the price to return to the broken level for its retest. If it is unsuccessful (which is supposed to be the case), a sell trade can be opened.

Triple bottom
A triple-bottom chart pattern is a bullish reversal chart pattern that is formed after the downtrend.
How to draw a triple bottom pattern? It represents three consecutive troughs on the price chart, which are approximately at the same level. The baseline of the pattern is drawn through the two highs between them, which can be horizontal or have a slight upward or downward slope. The pattern is considered to be formed after the price closes above the pattern’s baseline.
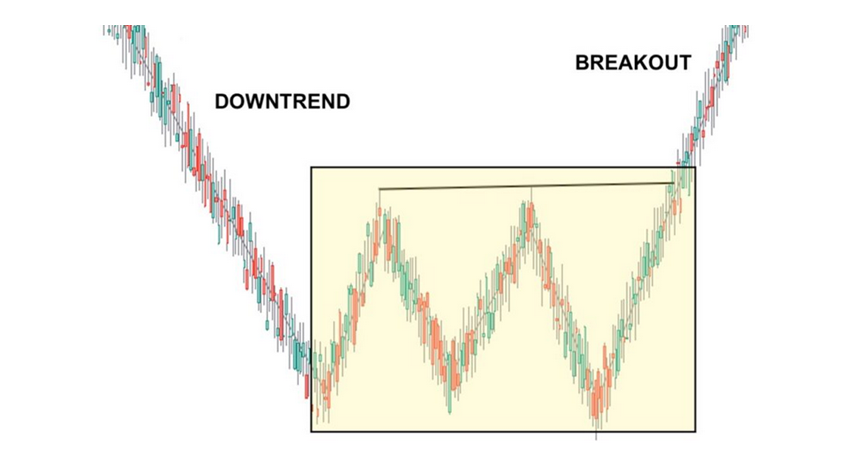
Triple bottom pattern
How to read the triple bottom pattern? A triple bottom pattern formation occurs when the price of a currency pair cannot break below a certain resistance level and bounces back three consecutive times. Due to its clear pattern – it’s fairly easy to identify the triple bottom pattern.
Simply put, the pattern comes at the end of a downward trend and has three bottoms at the same level. The confirmation of the pattern occurs when the price breaks above the neckline, which serves as a resistance level. When this happens, sellers lose control and buyers take over.
How to trade the triple bottom pattern? There are certain rules when trading with triple-bottom patterns:
- Firstly one should see the market phase if it is up or down. As the triple bottom is formed at the end of the downtrend, the prior trend should be the downtrend;
- Traders should spot if three rounding bottoms are forming and also note the size of the bottoms;
- Traders should only enter the long position when the price breaks out from the resistance level or the neckline.
Patterns of trend continuation
Rectangle
The Rectangle pattern reflects a pause in trend development when the price fluctuates in a sideways range between parallel support and resistance lines. This pattern on the chart represents a consolidation of price in anticipation of the continuation of a particular trend in the original direction.
Bullish rectangle
A bullish rectangle is a continuation pattern that develops during a strong uptrend.
When the pattern is formed, an upward break indicates a continuation of the bullish trend.
How to draw a rectangle pattern? The rectangle pattern looks like a sideways corridor in which the price chart consolidates, bounded by horizontal support and resistance levels. The rectangle is considered to be fully formed only after the price breaks through one of its borders.
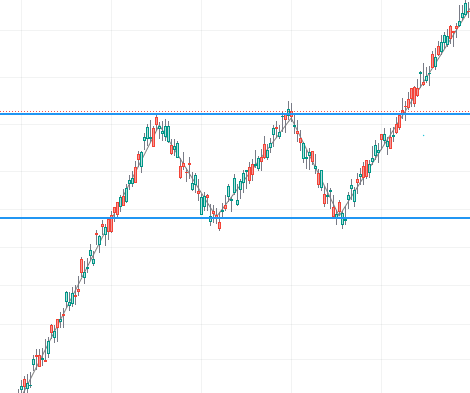
Bullish rectangle pattern
How to read the rectangle pattern? The essence of the pattern is as follows: there is uncertainty in the market. We see a horizontal consolidation, so it’s hard to know where the price is going to go. We should wait for one side of the rectangle to break through and open in that direction.
The rectangle pattern can appear on a chart in either an uptrend or a downtrend.
The bullish rectangle pattern occurs within an uptrend when traders tend to open longs when resistance levels are overcome and trades close in the “breakout zone”.
How to trade the rectangle pattern? You can trade the pattern either on a price break in the direction of the trend or inside the channel that forms the boundaries of the rectangle.
Bearish rectangle
A bearish rectangle is formed when the price consolidates for a while during a downtrend. Is a continuation pattern that occurs when a price pauses during a strong downtrend and temporarily bounces between two parallel levels before the trend continues.
How to draw a rectangle pattern? The rectangle pattern looks like a sideways corridor in which the price chart consolidates, bounded by horizontal support and resistance levels. The rectangle is considered to be fully formed only after the price breaks through one of its borders.
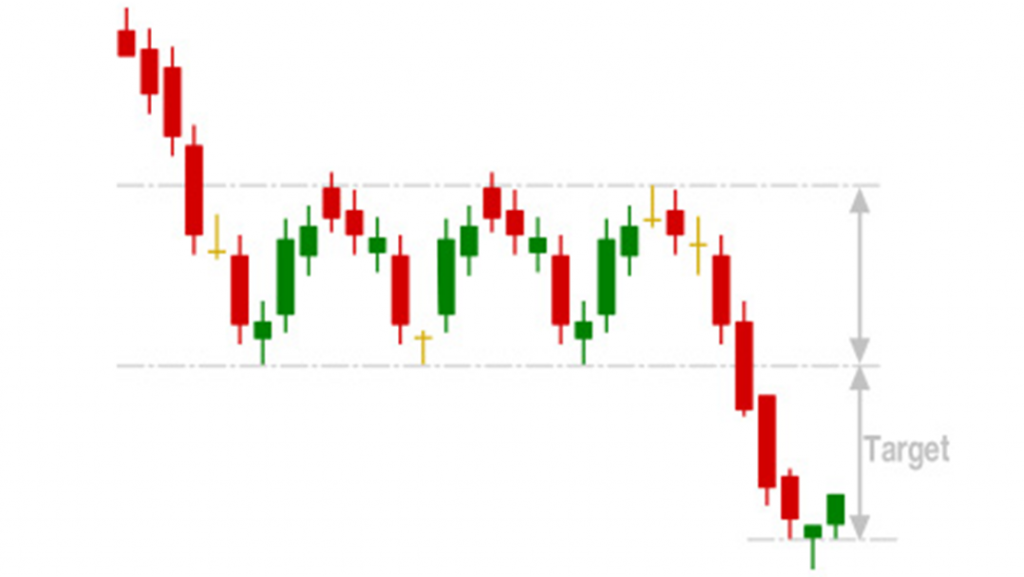
Bearish rectangle pattern
How to read the rectangle pattern? The essence of the pattern is as follows: there is uncertainty in the market. We see a horizontal consolidation, so it’s hard to know where the price is going to go. We should wait for one side of the rectangle to break through and open in that direction.
The bearish rectangle pattern occurs within a downtrend when traders tend to open shorts when they overcome a support level and close trading in the ‘breakout zone”.
How to trade the rectangle pattern? You can trade the pattern either on a price break in the direction of the trend or inside the channel that forms the boundaries of the rectangle.
Flag
A triangle is a type of continuation pattern indicating the likelihood of the continuation of a particular trend in the market.
A flag pattern is formed when the market consolidates in a narrow range after a sharp move. A flag can be seen on any time frame, but it usually consists of about five to fifteen price bars, although this is not an established rule.
The bullish flag pattern occurs during a bullish trend. The trend line forms a flagpole and the subsequent consolidation seems to complete the flag.
Bullish flag
A bullish flag is a pattern represented by a short pause in the trend followed by a swift upward price movement.
The bullish flag pattern occurs during a bullish trend. The trend line forms a flagpole and the subsequent consolidation seems to complete the flag.
How to draw a bullish flag pattern? A bullish flag consists of a flagpole and a flag. As such, it resembles a flag on a pole. It’s constituted after the price action trades in a continuous uptrend, making higher highs and higher lows. A bull flag resembles the letter F.
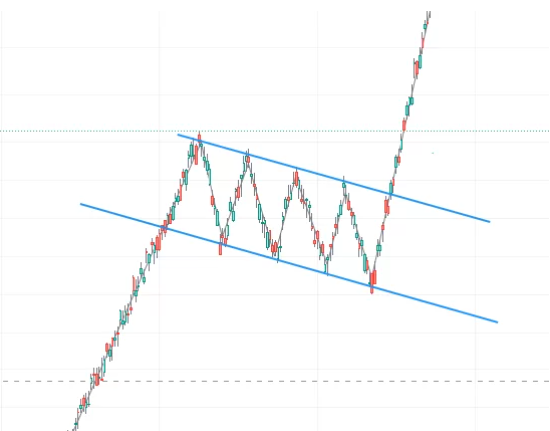
Bullish flag pattern
How to read the bullish flag pattern? The flagpole forms an almost vertical price spike as sellers get blindsided by the buyers, then a pullback that has parallel upper and lower trendlines, which form the flag.
To identify a bullish flag pattern, traders can take the following steps:
- Identify a flag pattern, which is the preceding sharp rise that is usually complemented by an increase in volume when traders react to a price move;
- If the asset continues to move towards consolidation, it is unlikely that a bullish flag pattern will form on the chart as the flagpole trend has continued to reverse;
- The point at which the price movement leaves the flagpole usually occurs when traders place their orders. The length of the flagpole is usually used to calculate the target profit.
How to trade the bullish flag pattern? To effectively exploit a bullish flag pattern, traders enter the market at the bottom of an emerging price channel or wait for a breakout above the top level of the price channel. To obtain the expected target level, the height of the flagpole preceding the formation of the flag must be projected to the breakout point.
Bearish flag
The bearish pattern implies an extension/continuation of an existing downtrend. The formation of a bearish flag occurs through an initial strong downtrend followed by an upward-sloping consolidation.
How to draw a bearish flag pattern? As it’s the case with a bullish flag, its bearish counterpart consists of the flagpole and a flag. The former is constituted after the price action trades in a downtrend, making the lower highs and lower lows.
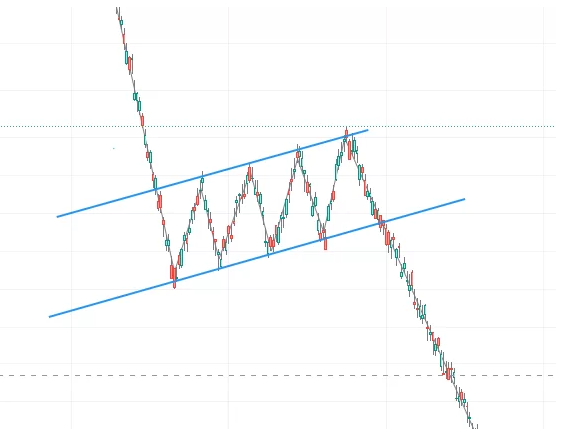
Bearish flag pattern
How to read the bearish flag pattern? The formation of the pattern begins with a downtrend in price due to a strong bearish momentum, which continues until a new support level is reached.
Once the new low is established, the price begins to bounce upwards as sellers take a breather. This consolidation takes place inside a parallel channel.
The buyers are using the consolidation to try to weaken the momentum of the sellers, who are controlling the price movement. The bears, on the other hand, are taking a step back to consolidate recent gains and prepare for another fall.
Depending on the strength of the downtrend, the rebound could be sharper or softer.
How to trade the bearish flag pattern? When the bearish flag pattern is formed its price action fluctuates upwards and creates both support and resistance lines. The bearish flag is confirmed once the price falls through the flag’s support line. As such, the best way to trade the bearish flag is to wait for the price to fall through its support and then enter a short position.
Pennant
One of the classic trend continuation patterns is the pennant pattern. It can be formed both in a downward and an upward market. The pennant should be distinguished from similar patterns like a wedge or a flag.
The pennant pattern looks similar to a symmetrical triangle but differs from the pattern with the same name by its shorter formation period. The similarity with the flag pattern is explained by the presence of a flagpole in both patterns. But the so-called flag pattern of the pennant is directed against the flagpole and its lower line cannot be parallel to the upper line.
Bullish pennant
A bullish pennant is a trend continuation pattern indicating a pause in price movement halfway through a strong uptrend.
How to draw a bullish pennant pattern? The bullish pennant pattern consists of two elements. It is a pen formed by one or more abnormal bullish candles. After them, the pattern pen begins to form, which looks like a triangle.
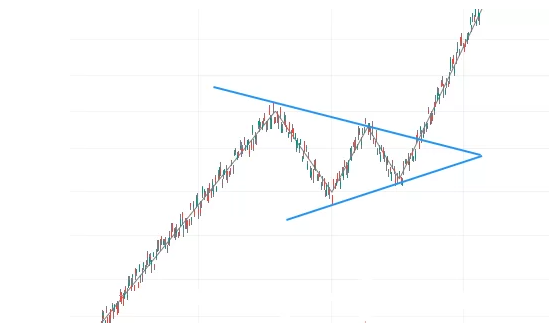
Bullish pennant pattern
How to read the bullish pennant pattern? A bullish pennant pattern is formed after a sharp rise in the prices of the stock. After a long uptrend, traders try to close their position with the assumption that a reversal is going to come. The prices begin to consolidate as the traders start exiting the stock. But at the same time, new buyers start buying the stock which results in the breakout of the prices in the same direction as the prior uptrend.
How to trade the bullish pennant pattern? A trader is advised to wait for a breakout to take place before entering the long trade.
A position can be opened no sooner than the pennant canvas has finished drawing. To understand when this will happen, it is necessary to draw support and resistance lines at the extreme points of the triangle. Entry into the trade is made after the breakdown of the upper boundary of the pattern.
Bearish pennant
A bearish pennant is a trend continuation pattern indicating a pause in price movement halfway through a strong bearish trend.
How to draw a bearish pennant pattern? A bearish pennant is formed immediately after a sharp fall in price, with up and down swings taking on a triangular flag pattern, gradually forming lower highs and higher lows.
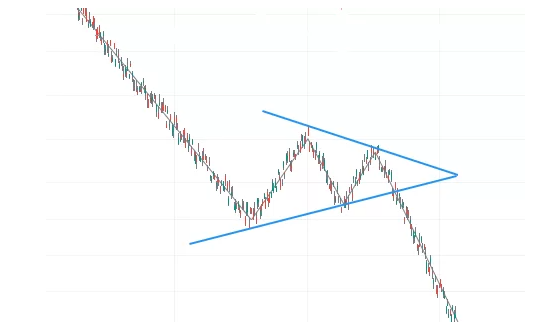
Bearish pennant pattern
How to read the bearish pennant pattern? A bearish pennant is formed during a steep, almost vertical, downtrend. After that sharp price drop, some sellers close their positions while other sellers decide to join the trend, making the price consolidate for a bit.
As soon as enough sellers jump in, the price breaks below the bottom of the pennant and continues to move down.
How to trade the bearish pennant pattern? In a bearish pennant pattern, you should place a sell-stop trade slightly below the lower side of the pattern. In this case, if there is indeed a bearish breakout pattern, the stop trade will be triggered. The initial take profit should be at the lower side of the pennant hoist.
Triangle
A triangle pattern is a type of continuation pattern indicating the likelihood that a particular trend in the market will continue. A triangle is formed on a chart when the tops and bottoms of prices move toward each other, similar to the sides of a triangle.
Ascending triangle
The ascending triangle is a bullish continuation pattern and is characterized by a rising lower trendline and a flat upper trendline that acts as support.
How to draw an ascending triangle pattern? The ascending triangle is closest in shape to a right triangle. The upper resistance level runs through two or more consecutive highs that are approximately equal in height. In a classical case, this line should be horizontal, however, in the practice of technical analysis its insignificant slope is considered admissible. The lower support line is drawn through two or more consequent lows, each of which will be higher than the previous one. If you continue these lines until they intersect, you will get a figure resembling a rectangular triangle.
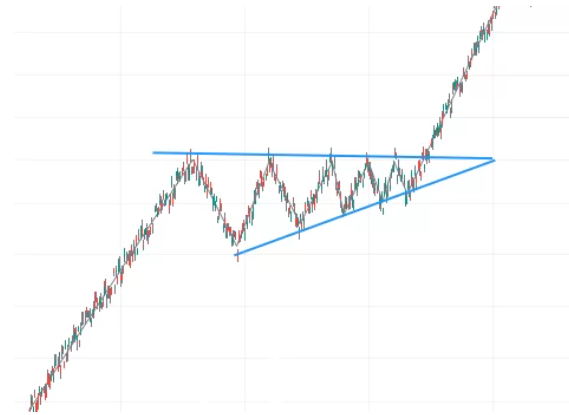
Ascending triangle pattern
How to read the ascending triangle pattern? This pattern indicates that buyers are being more aggressive than sellers as higher lows are reached in the market. Gradually the price is heading towards a flat upper trend line and the closer they are, the more likely an upward bullish breakout.
How to trade the ascending triangle pattern? Open a position after breaking through the resistance line (which corresponds to the upper side of the triangle). If we open manually, we wait for the price to close outside the resistance line. If we open by placing a pending Buy Stop order, we place it 5-10 points above the resistance line.
Descending triangle
The descending triangle is a bearish pattern that is characterized by a descending upper trendline and a flat lower trendline.
How to draw a descending triangle pattern? In the classic case, the shape of this pattern resembles a right triangle. Two or more consecutive lows of approximately equal height for a horizontal support line. The upper resistance line is formed by two consecutive highs, with each successive high being lower than the previous one. If these lines continue to the point of intersection, they graphically form a right triangle in which the resistance line is the hypotenuse and the support line is the cathetus.
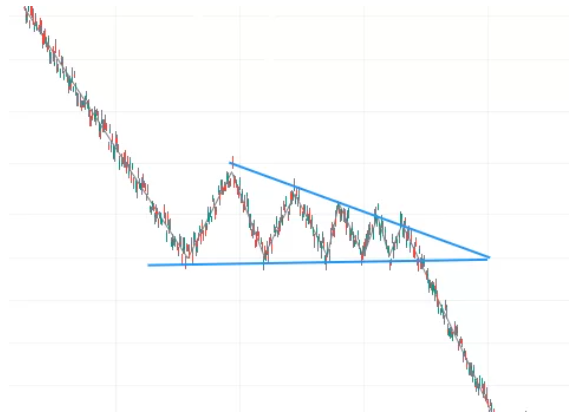
Descending triangle pattern
How to read the descending triangle pattern? This pattern indicates that sellers are more aggressive than buyers as the price continues to make lower highs. The pattern completes itself when the price breaks out of the triangle in the direction of the overall trend.
How to trade the descending triangle pattern? You can trade for a breakout of the descending triangle by placing a stop order to sell below the support level. The more times the price tests the support of the descending triangle, the more likely a breakout will occur. If you miss a breakout of a descending triangle, you can try trading on a retest of the breakout point.
Symmetrical triangle
A symmetrical triangle is a neutral pattern, but if it is formed after a strong and pronounced trend, there is a high probability that after its formation, the market will continue its movement in the original direction. In this case, the symmetrical triangle will be a continuation pattern.
How to draw a symmetrical triangle pattern? A symmetrical triangle is formed by two trend lines connecting as a series of peaks and troughs. Both trend lines should converge with approximately the same slope.
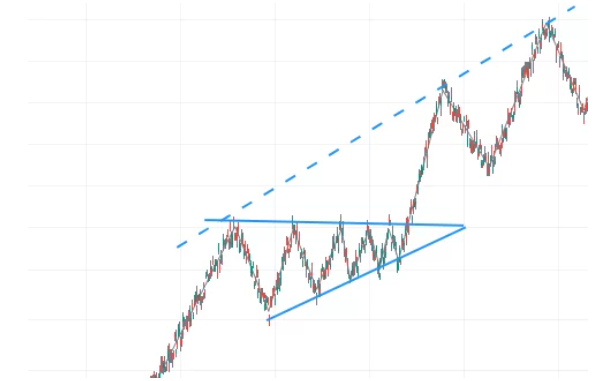
Symmetrical triangle pattern
How to read the symmetrical triangle pattern? This pattern can be formed either during an uptrend or during a downtrend, so it is neutral. The formation of this pattern most often indicates temporary indecision of buyers and sellers. As a result, the trend lines start to converge and the volume keeps decreasing or remains low. However, when significant volume appears, one of the lines manages to break through, which is a signal to the market in which direction it should move. Although the pattern itself is neutral, in most cases it does lead to a continuation of an established trend.
How to trade the symmetrical triangle pattern? A position is opened using pending orders placed on either side of a possible exit from the triangle (one to buy, the second to sell). As a result, when one of the triggers the orders, the second should be removed.
Wedge
A wedge pattern predicts an impending reversal of a market trend.
This pattern may be either a continuation of an existing pattern or a reversal pattern, depending on the type of wedge and the previous trend.
The wedge pattern is visually similar to a triangle but differs in that both its lines are directed in the same direction.
Falling wedge
The falling wedge pattern is a continuation pattern formed when the price bounces between two downward-sloping, converging trendlines.
How to draw a falling wedge pattern? The shape of the wedge is a cone that has a pronounced downward slope, which is a distinctive feature of this figure. The falling wedge should also not be confused with a symmetrical triangle, which has virtually no upward or downward slope.
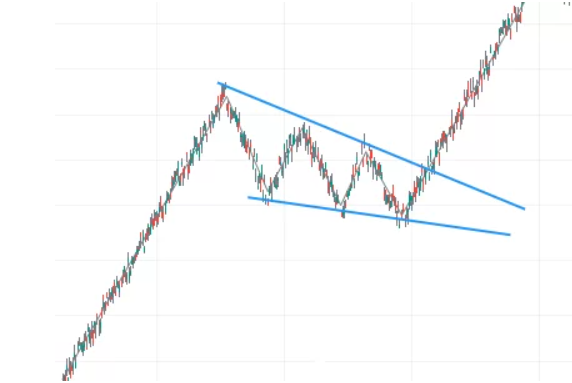
Falling wedge pattern
How to read the falling wedge pattern? A falling wedge occurs when several factors are present. First, the price of the asset must be in a strong uptrend.
When the price rises, it reaches a point where bulls begin to question how high it can go. As a result, some start selling and taking profits, which pushes the price down.
When the price falls, some bulls start to enter the market but exit after a while. The price then breaks out and continues its upward trend.
How to trade the falling wedge pattern? Since the descending wedge is a bullish pattern, aggressive traders usually wait for the price to retest the upper resistance line before opening a long position. Conservative traders wait for the price to retest the upper resistance line from above before opening a long position.
The ideal target location would be the upper level where the downward wedge began, with a stop loss a few points below the last low before the breakout occurred.
Rising wedge
The rising wedge is one of the reversal patterns that signal an impending change from a bullish trend to a bearish one.
How to draw a rising wedge pattern? The shape is that of a cone with a pronounced upward slope. It can be confused with a symmetrical triangle, which has little or no upward or downward slope.
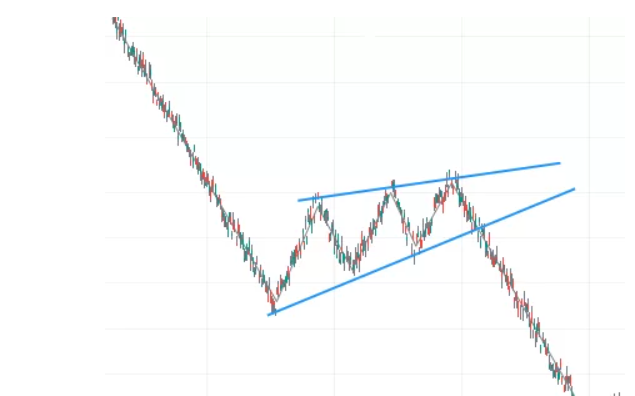
Rising wedge pattern
How to read the rising wedge pattern? An ascending wedge pattern is formed when price growth slows down and a tapering pattern is formed. Prices seem unable to rise further, but at the same time continue to update local highs. This is primarily a signal that the seller’s pressure in the market is gradually increasing.
The moment prices break through the bottom line of the wedge, a sell signal is formed.
How to trade the rising wedge pattern? There are several different strategies for trading in a rising wedge pattern. You can select the technique that better matches your trading style or combine several different strategies to identify the trade entry and exit points.
When to enter the market:
- Sell below the support line.
- Sell when the support line turns into resistance.
- Sell on resistance below the support line.
Conclusion
Patterns help the trader to predict the development of the market and ticker price changes. Technical analysis patterns do not guarantee market development in the n-direction. Nevertheless, technical analysis is used in trading on par with fundamental analysis, as it gives the trader a better understanding of the market.
Join the CScalp Trading Community
Join our official trader's chat. Here you can communicate with other scalpers, find trading soulmates and discuss the market. We also have an exclusive chat for crypto traders!
Don't forget to subscribe to our official CScalp news channel, use trading signals and get to know our bot.
If you have any questions, just contact our platform's support via Telegram at @CScalp_support_bot. We will respond in a matter of seconds.
You can also visit our Discord channel and subscribe to the CScalp TV YouTube channel.
JOIN OUR CHAT
