
Main technical analysis indicators
We have prepared a list of the main indicators of technical analysis. The list contains trend technical indicators and oscillators used by stock and cryptocurrency traders. We also recommend you to get into the list of the main patterns of technical analysis.
Attention! This article is for informational purposes only and does not contain recommendations or calls to action.
The review has been prepared by the CScalp terminal team. You can get CScalp by leaving your e-mail in the form below.
Relative Strength Index (RSI)
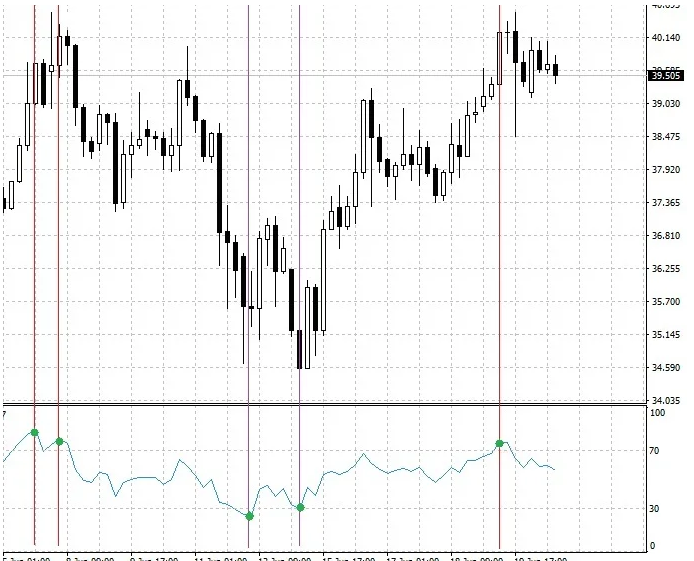
The Relative Strength Index (RSI) is a momentum indicator. It is used to assess whether an asset is overbought or oversold. RSI analyzes recent price changes and provides data in the form of an oscillator ranging from 0 to 100.
If the relative strength index increases while the price rising, it may indicate a strong upward trend. If the technical indicator is decreasing, but the price is increasing, the asset is likely to fall soon. Traditionally, it is believed that if the RSI is more than 70, then the asset is overbought, less than 30 – oversold.
Moving Average (MA)
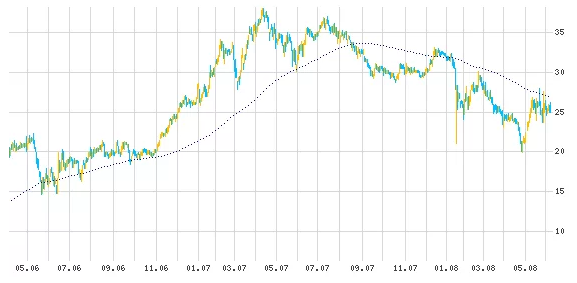
The moving average smooths out the price fluctuations of an asset to highlight the direction of the trend. In technical analysis, traders use a Simple Moving Average (SMA) or Exponential Moving Average (EMA).
Simple moving average is formed based on the data for the n-period and their average value. An exponential moving average uses data from the latest price changes, so it is a more sensitive technical indicator. Sometimes traders use moving average crossovers.

Moving Average Convergence/Divergence (MACD)
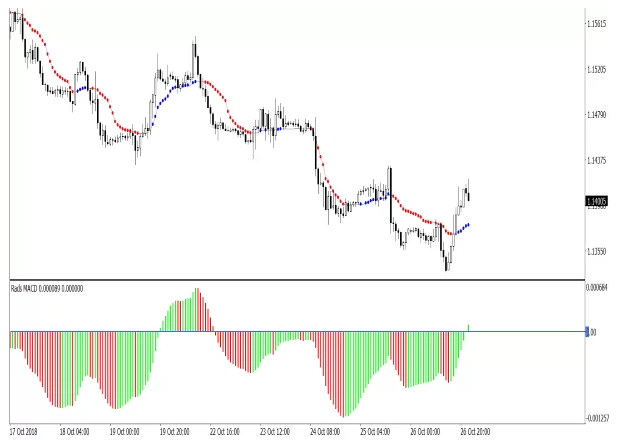
The technical analysis indicator MACD is used to predict price movement due to the relationship of two moving averages. The MACD is determined by subtracting the 26-day exponential moving average from the 12-day one. These are standard parameters that a trader can change for himself.
The indicator consists of a MACD line and a signal line (9-day EMA). While using a technical indicator, a histogram is used, which displays the distance between two lines. The indicator is used to determine the strength of the current trend and the buy/sell entry point. It is considered that a buy signal is the crossing of the MACD signal line from bottom to top, and a sell signal – from top to bottom.
RSI Stochastic
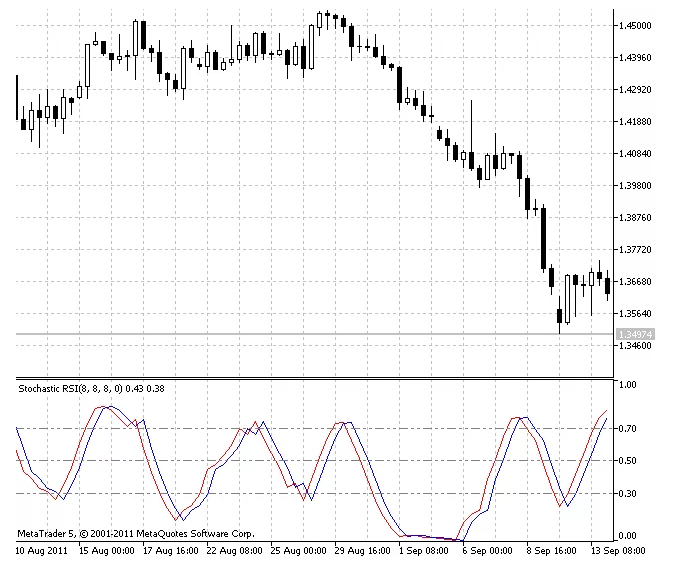
Stochastic RSI is an oscillator that tracks price movement and determines whether an asset is overbought/oversold. Stochastic generates readings based on the underlying RSI data. Technical indicator settings are in the range from 0 to 1.
It is considered that if the stochastic RSI readings are above 0.8, then the asset is overbought. Below 0.2 is oversold. 0/1 values can indicate the lowest/highest value for the measured period. This is a very sensitive technical indicator that generates many signals, often false ones. Usually it is used when its indicators are near the upper or lower values.
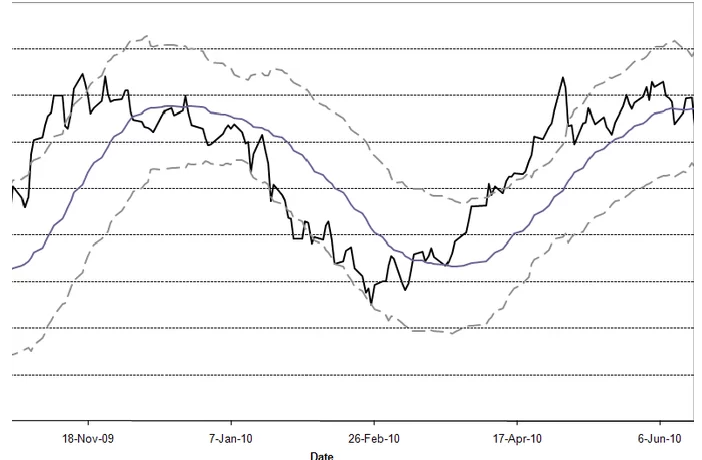
Bollinger Bands
The Bollinger Band technical indicator is used to measure market volatility and determine the overbought/oversold level of an asset. The indicator consists of the upper, middle (SMA) and lower bands. The distance between the lines is related to the level of volatility.
It is believed that the proximity of the price to the upper line indicates that the asset is overbought, to the lower line – about oversold. With strong market movements, the price can go beyond the upper or lower line. The Bollinger Bands squeeze occurs when market volatility is low. Finding lines close to each other may indicate high volatility in the future, at a great distance from each other about the prospect of low volatility.
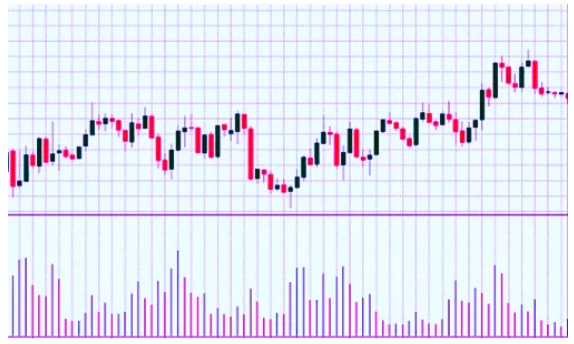
Volume indicator
The volume indicator is used to determine the reliability of the formed trend, namely how many traders are buying or selling an asset at the moment. The higher the volume of buying or selling, the stronger the trend.
Typically, the volume indicator is used while trading breakouts: when the price rises above the resistance line or falls below the support line. If the breakout is accompanied by a lot of buying or selling.
Conclusion
Typically, technical analysis indicators are used in swing trading and medium-term trading on stock and cryptocurrency exchanges. Intraday traders and scalpers are primarily guided by the order book, the tape of transactions and clusters, rarely using technical indicators in trading.
The readings of technical analysis indicators should not be taken as a direct signal to buy or sell an asset. Technical indicators can give false signals. To obtain more objective information about the market in technical analysis, it is worth using several indicators at the same time, as well as using other methods of analysis.
We recommend that novice traders familiarize themselves with our free scalping course. We have prepared a cryptocurrency scalping course.
Join the CScalp Trading Community
Join our official trader's chat. Here you can communicate with other scalpers, find trading soulmates and discuss the market. We also have an exclusive chat for crypto traders!
Don't forget to subscribe to our official CScalp news channel, use trading signals and get to know our bot.
If you have any questions, just contact our platform's support via Telegram at @CScalp_support_bot. We will respond in a matter of seconds.
You can also visit our Discord channel and subscribe to the CScalp TV YouTube channel.
JOIN OUR CHAT