Support and Resistance Trading Strategy: Key Indicators and Techniques
Support and resistance levels, crucial to the support and resistance trading strategy, are the boundaries of price movements. These levels help traders understand how low and how high the price can go in the current market cycle. CScalp delves into this concept to help to enhance your trading strategy.
Attention! This article is for informational purposes only and does not contain recommendations or calls to action.
The review has been prepared by the CScalp terminal team. You can get CScalp by leaving your e-mail in the form below.
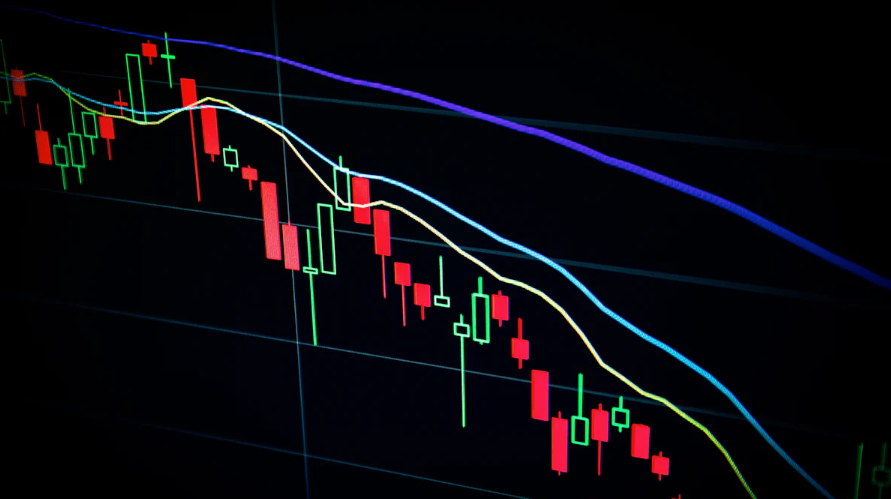
Unsplash
Understanding Support and Resistance Zones
Traders use support and resistance levels to plan trades effectively, making them indispensable tools in technical analysis. Most trading strategies are built around these levels.
To take full advantage of support and resistance trading strategy, try the professional trading platform CScalp by leaving your email in the form above. With the free terminal, you will be able to connect to your preferred exchange and place orders with one click, as well as automatically manage your risks.
Definition and Explanation
The resistance level is the highest price in the current cycle. It is a figurative “ceiling”: it holds back the price and prevents it from going higher.
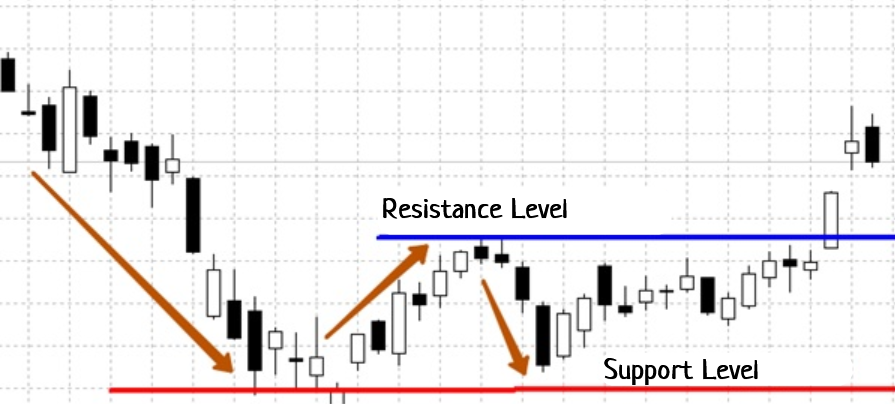
Levels in sideways trends/ CScalp
In other words, resistance represents a price level where an uptrend can pause due to a concentration of supply. When the price of an asset rises to a resistance level, sellers often step in, causing the price to dip back down. Traders identify resistance levels by examining historical data where prices have consistently stopped rising and reversed direction. Resistance levels act as a ceiling, preventing prices from climbing further.
The support level is the lowest price in the current cycle. It is a figurative “floor” – it “supports” the price and prevents it from going lower. These levels define the trading range within the current time frame.
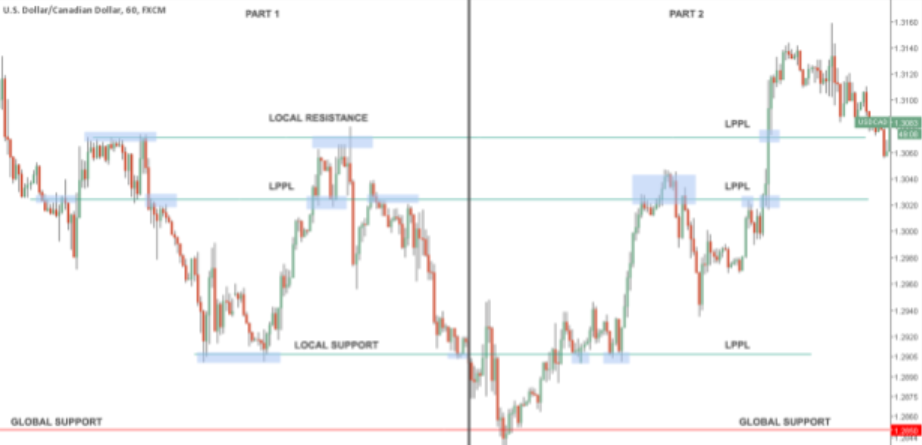
CScalp
Thus, support refers to a price level where a downtrend can pause due to a concentration of demand. When the price of an asset falls to a support level, buyers often step in, causing the price to bounce back up. Traders identify support levels by looking at historical data where prices have consistently stopped falling and reversed direction. Support levels act as a floor, preventing prices from declining further.
To learn more about historical data, check out our article: “What is Historical Data: Strategic Planning and Insight.”
Global and Local Levels
In trading, levels can be classified as either global or local, based on the time frames they appear on and their relevance to different types of traders.
Global Levels:
- Time Frames: Global levels are identified on longer time frames, such as daily (1D), four-day (4D), weekly (1W), and beyond.
- Visibility: These levels are visible to all market participants and often indicate major support or resistance points.
- Who Uses Them: Position traders, institutional traders, and investors typically work with global levels due to their long-term significance.
Local Levels:
- Time Frames: Local levels are formed on shorter time frames, such as hourly or four-hour charts (below 4D).
- Who Uses Them: These levels are particularly important to swing traders, day traders, and scalpers who focus on short-term market movements.
Relationship Between Global and Local Levels:
- Independence: Global and local levels are generally not directly related. For instance, a resistance level on a weekly chart might not correspond with price movements seen on hourly charts.
- Local Variations: In situations where a global resistance level exists, an asset may trade far from this level on shorter time frames. This often results in the formation of smaller, local support and resistance levels on charts like 4-hour or 1-hour.
Price Interaction with Levels:
- Testing Levels: As the price approaches a level, it “tests” it, attempting to break through.
- Bounce or Breakout: If the level is strong, the price will typically bounce off and may revisit it later. If the level is not strong enough, a breakout will occur, leading to a significant price movement beyond the level.

Mirror and Inclined Levels
A mirror level is a concept where a price level alternates between acting as support and resistance. This occurs when a price level that previously served as resistance becomes support, and vice versa.
Resistance Becomes Support:
- Initially, the price struggles to move above a certain resistance level.
- Once the price successfully breaks through this resistance, it moves higher.
- If the price pulls back, the former resistance level may now act as support, preventing the price from falling further.
- Traders often see this as confirmation of a new trend direction, where the old resistance acts as a “floor” supporting the price.
Support Becomes Resistance:
- Conversely, a support level that the price fails to hold can turn into resistance if the price drops below it.
- As the price attempts to rise again, the former support level may now act as resistance, capping upward movement.
Practical Examples:
- Breakout Scenario: Imagine a stock trading in a range between $50 and $60. If the stock breaks above the $60 resistance level and moves to $65, then pulls back to $60, the $60 level may now act as support. This indicates a bullish sentiment, as buyers use the previous resistance as a buying opportunity.
- Trend Reversal: In a downtrend, a support level at $40 may eventually break, causing the price to drop to $35. If the price rises back to $40, it might now serve as a resistance level, with sellers stepping in to push the price back down.
Importance for Traders:
- Confirmation: Mirror levels provide confirmation of potential trend changes, helping traders make more informed decisions.
- Entry and Exit Points: These levels are crucial for identifying strategic entry and exit points. Traders often enter positions when the price confirms a mirror level and set stop-loss orders to manage risk effectively.
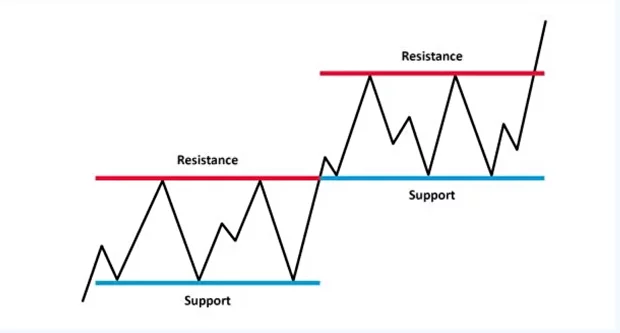
Mirror level: resistance becomes support (or vice versa)/ CScalp
Levels can also be inclined, along a trend line. Such a level is called a “trend channel.” Inclined levels are formed from ascending or descending trend lines. In such a trend, each new “high” or “low” rises or falls by an equal percentage. As a result, smooth inclined levels are formed.
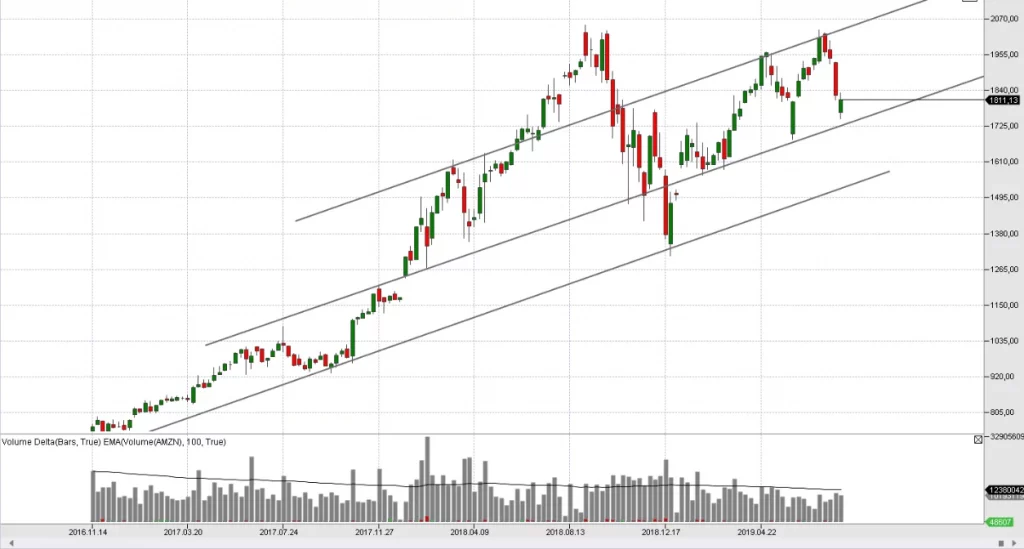
Inclined Levels (Trend Channels)/ CScalp
An inclined level “works” similarly to a horizontal one – the price can break through it, pierce it, or bounce off it. The difference is that the trend channel is relevant as long as the trend “lives.” Horizontal levels can hold for a long time and encompass several trends.
Additionally, horizontal levels are easier to identify early on – a strong bounce and subsequent retest (re-touch) are sufficient. Inclined levels are formed by gradual increases or decreases in highs and lows, making it challenging to identify such a level at the very beginning.
Context and References
The concept of support and resistance has roots in technical analysis, which emerged in the early 20th century. Charles Dow, the founder of Dow Theory, played a significant role in developing these concepts. Dow’s observations on market behavior laid the foundation for identifying key price levels where market trends tend to reverse. Traders began using these concepts to make informed decisions about buying and selling assets.
Over time, the methods for identifying support and resistance levels have evolved. Initially, traders relied solely on historical price data to determine these levels. As technology advanced, new tools and indicators emerged, enhancing the accuracy of identifying support and resistance. Modern traders now use trendlines, moving averages, and other technical indicators to pinpoint these crucial levels more effectively.
Prominent traders and analysts emphasize the importance of incorporating multiple indicators to validate support and resistance levels. For example, John Murphy, a well-known technical analyst, suggests combining moving averages with support and resistance levels to increase the reliability of trading signals.
Moreover, using Fibonacci retracement levels can provide additional confirmation for these key levels. According to Carolyn Boroden, an expert in Fibonacci analysis, the convergence of Fibonacci levels with traditional support and resistance points often marks strong price reaction zones.
A notable case study is the 2020 Tesla stock performance, where support and resistance levels played a crucial role. Throughout 2020, Tesla (TSLA) experienced significant price fluctuations, with clear resistance around $500 and support around $300. Traders who identified and respected these levels could make profitable decisions by buying near support and selling near resistance, effectively capturing price movements within this range.
To substantiate the effectiveness of support and resistance trading strategies, consider the following statistics: A study by FXCM found that 70% of successful trades were made using support and resistance levels as primary indicators. Additionally, research by the Chartered Market Technician (CMT) Association indicates that combining support and resistance levels with volume analysis can improve trading accuracy by up to 30%.
How to Build Support and Resistance Levels
“Good” support and resistance levels follow these criteria:
- Relevance: When searching for levels, consider your trading style and working time frames. For example, swing traders will look for levels on 1D and 1W time frames. Day traders will focus on 1D and 4h, while scalpers will look at 4h and 1h. It always makes sense to refer to higher time frames. Monthly and weekly levels can intersect with daily and hourly levels, causing significant intraday price movements.
- Recent Formation: Day traders and scalpers do not need levels that were formed weeks ago, nor do swing traders need hourly levels. The general principle is that the level should have been formed in the “recent” past. For scalpers, this may be from 2 to 6-8 hours, for day traders from several hours to 2-3 days, and for swing traders several days or weeks.
- Close to Market Price: Similar to the age of the level, it should also be close to the market price and points of interest. For example, if BTC is trading within $25,000 / $26,000, a level at $32,000 is unlikely to interest us, especially if it was formed months or years ago.
- Clear Reactions on High Volumes: An important criterion in finding a level is observing two or more clear reactions. The more reactions (bounces) from the level, the more valid and “stronger” it is. An additional confirmation is increased volumes at each touch of the level. The screenshot below shows an example of a strong resistance level. Each test of the level is accompanied by increased volumes.
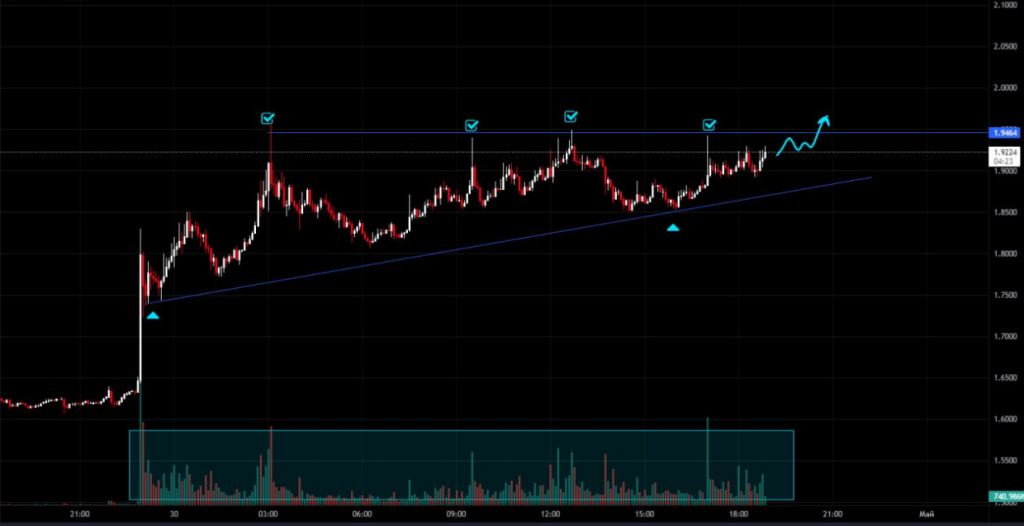
Testing resistance levels on high volumes/ CScalp
5. Simplicity and Obviousness: The level should be simple and obvious; it should not need to be searched for or “invented.” The analysis of levels should be based on the principle of the majority: if the level is visible to everyone, then everyone is working with it. However, the concept of “everyone” is relative. “All” scalpers will not look at weekly levels, and “all” swing traders do not look at annual levels.
6. Significant Bounces: For a level to be valid, it is important that the price amplitude approaching it is significant. This is a relative measure, depending on the time frame and the overall volatility of the asset. For example, if an instrument moves 1-3% during the day, then movements to and from local levels can be measured in tenths of a percent (0.1-0.5%). If the asset is volatile – rising and falling, say, 15% in one day – then movements to and from levels can be several percent.
Identifying Support and Resistance Key Levels Through Technical Analysis
Understanding these methods and tools allows traders to identify support and resistance levels more effectively. Mastering these techniques improves trading strategies and increases the likelihood of success in the market.
Where Do Support and Resistance Levels Come From
To understand the “anatomy” of support and resistance levels, it is essential to grasp the trading logic of large players – they are the ones who create key levels. The order book helps in working with levels, particularly through the analysis of densities.
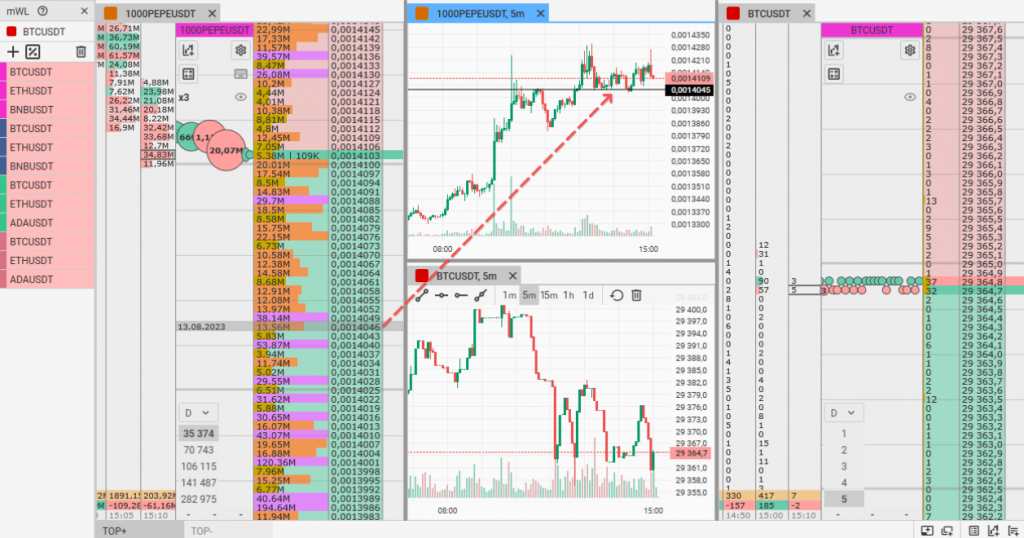
The order book densities (on the right) hold the price at support levels (on the chart on the left)/ CScalp
Density in the order book refers to a large cluster of limit orders (i.e., large volumes) at a certain price. In other words, it is the place where large participants have “thrown in” significant volumes of the asset. One could say that it is these limit densities that determine the boundaries of the levels.
As is known, price movement is determined by buying and selling. If the volumes of buying and selling are equal, the price stays in place. Upward movement indicates a predominance of buyers in the market, while downward movement indicates a predominance of sellers.
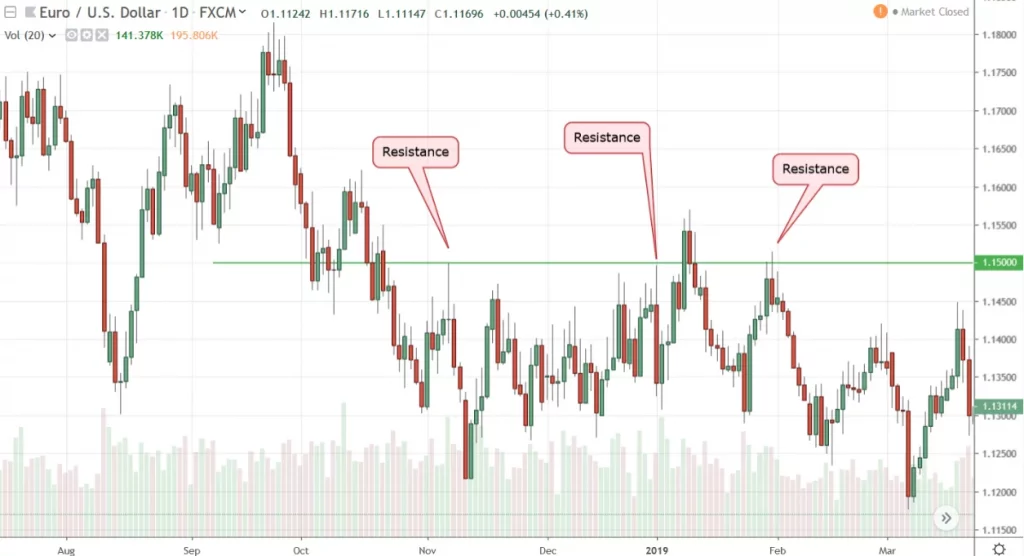
The resistance level indicates a lack of buying strength./ CScalp
If the price moves up and “hits” resistance, it means that the limit volumes for selling are greater here than the circulating volumes for buying. In other words, a large player has placed a sell order that the “crowd” cannot fully purchase. In this scenario, the price rolls back and “searches” for a new range. With support levels, the story is the opposite.
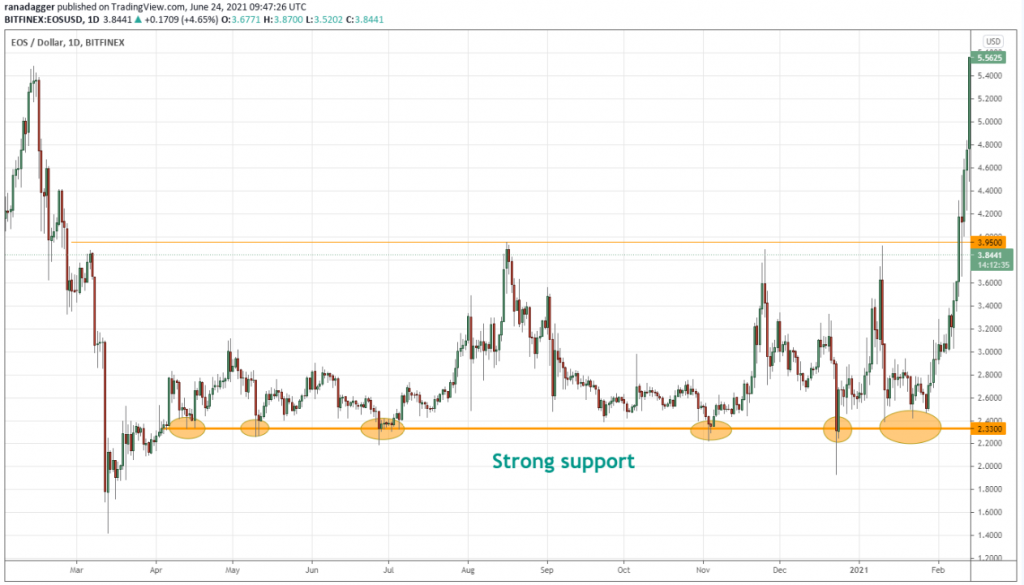
The support level indicates a lack of sellers’ strength/ CScalp
If moving downwards, the price “lands” on a support level, it means that there is a large cluster of limit buy orders at this level that the market is not yet able to sell off. As long as there are not enough volumes in the market to “eat through” this order, the price will not go lower.
Is a Level a Range or a Line?
There is a debate among traders about whether a level is considered a single line or a range around it. There is also a discussion about whether to draw levels from the ends of candle bodies or from the wicks. In reality, it depends on the situation.
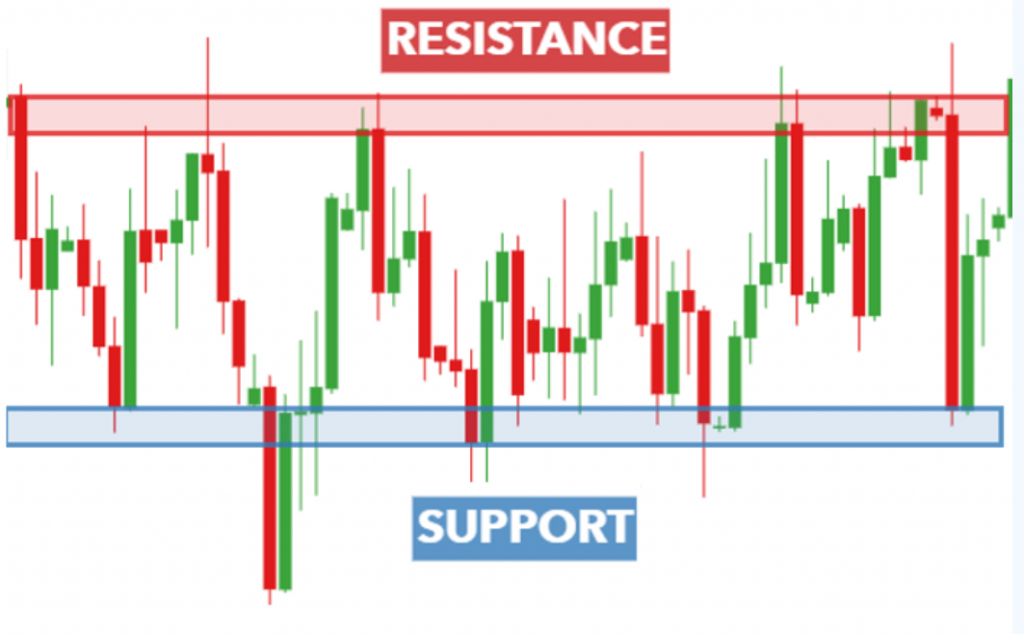
Support and resistance levels/ CScalp
Most obvious levels pass through a single point and look like a clear line. However, it is not uncommon for a level to be “smeared” across a range. This is often observed during “piercings” or false breakouts.
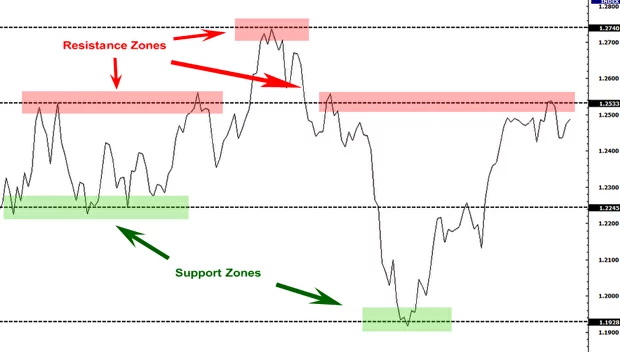
Alternating Zones and Lines/ CScalp
It is important to understand that the price moves along levels in one way or another. If a level is visually obvious but does not “align” on a single line, it means the level itself is within a range. Typically, this range is fairly narrow. Such levels can usually be “fitted” between the wicks of the candles that pass through it.
Methods of Identification: Historical Data and Moving Average
- Using Historical Data: Historical data provides a foundation for identifying support and resistance levels. Traders examine past price movements to find points where prices consistently reversed. These points often indicate strong support or resistance levels. By analyzing historical data, traders can predict future price behavior. This method relies on the principle that history tends to repeat itself in financial markets.
- Using Trendlines: Trendlines help traders identify support and resistance levels by connecting significant price points on a chart. An upward trendline connects a series of higher lows, indicating support. A downward trendline connects a series of lower highs, indicating resistance. Drawing trendlines requires precision and practice. Accurate trendlines provide valuable insights into market trends and potential reversal points.
- Using Moving Averages: Moving averages smooth out price data to create a single flowing line. Traders use this line to identify support and resistance levels. A moving average acts as support when prices stay above it. It acts as resistance when prices stay below it. Commonly used moving averages include the 50-day and 200-day averages. These averages help traders spot long-term trends and make informed trading decisions.
Tools and Indicators
- Fibonacci Retracement: uses horizontal lines to indicate areas of support or resistance at key Fibonacci levels before the price continues in the original direction. Traders use this tool to identify potential reversal levels. The most common Fibonacci levels are 38.2%, 50%, and 61.8%. These levels often coincide with significant price points, making them useful for predicting market behavior.
- Pivot Points: serve as a predictive indicator for market movements. Traders calculate pivot points using the high, low, and closing prices of previous trading sessions. These points help identify potential support and resistance levels for the current trading session. Pivot points offer a straightforward method for determining market sentiment and potential price reversals.
- Volume Analysis: examines the number of shares or contracts traded in a security or market. High trading volume at a support or resistance level indicates strong interest and potential price reversal. Low volume suggests weak interest and a potential continuation of the current trend. Traders use volume analysis to confirm the strength of support and resistance levels. This method enhances the accuracy of trading decisions.
Practical Applications of Support and Resistance Trading Strategy for Traders
Most trading strategies are built around support and resistance levels. These levels help understand the strength and potential of the price within different ranges.
Trading Strategies
- Bounce Trading: involves buying an asset when its price hits a support level and selling when it reaches a resistance level. Traders look for confirmation signals, such as candlestick patterns or volume spikes, to validate the bounce. This strategy capitalizes on the market’s tendency to respect historical support and resistance levels. By entering trades at these key points, traders aim to profit from the price movement between support and resistance.
- Breakout Trading: focuses on entering a trade when the price breaks through a significant support or resistance level. A breakout above resistance indicates strong buying interest, while a breakout below support suggests strong selling pressure. Traders use this strategy to capture substantial price movements that often follow breakouts. Confirmation tools, such as increased volume or momentum indicators, help validate the breakout and reduce the risk of false signals.
Risk Management
Setting stop-loss orders is crucial for managing risk in a support and resistance trading strategy. A stop-loss order automatically sells an asset when its price falls to a predetermined level. Traders place stop-loss orders below support levels for long positions and above resistance levels for short positions. This practice limits potential losses and protects capital. Effective use of stop-loss orders ensures that traders can exit losing trades before significant damage occurs.
Position sizing determines the amount of capital allocated to each trade. Proper position sizing helps manage risk and maintain a balanced portfolio. Traders calculate position sizes based on their risk tolerance and the distance between the entry point and the stop-loss level. Smaller position sizes reduce risk exposure, while larger positions increase potential returns. Consistent position sizing is essential for long-term success in support and resistance trading strategies.
Psychological Aspects of Support and Resistance Trading Strategy
Understanding the psychological aspects of support and resistance trading strategy improves decision-making. By recognizing market sentiment and herd mentality, traders can better anticipate price movements.
Market Sentiment
Traders often look at past support levels where the price previously reversed. This creates a self-fulfilling prophecy as traders remember these levels and anticipate price bounces. Positive sentiment can drive prices up to resistance levels. Negative sentiment can push prices down to support levels. Understanding market sentiment helps traders predict potential price movements.
Herd Mentality
Herd mentality influences many traders’ decisions. When a large group of traders believes a support or resistance level will hold, they act accordingly. This collective behavior reinforces the strength of these levels. For example, if many traders buy at a support level, the increased demand can cause the price to bounce back up. Conversely, if many traders sell at a resistance level, the increased supply can cause the price to dip. Recognizing herd mentality can provide valuable insights into market dynamics.
Emotional Discipline
Overtrading poses a significant risk to traders. Emotional reactions to market fluctuations often lead to excessive trading. This behavior can result in substantial losses. Traders should stick to their predefined strategies and avoid impulsive decisions. Setting clear entry and exit points based on support and resistance levels helps control trading frequency.
Support and Resistance Trading Strategy – Conclusion
Understanding the support and resistance trading strategy can transform your trading approach. Practice and continuous learning remain essential for mastering these concepts. Start by applying the strategies in a demo account to gain confidence. Consistent practice will enhance your skills and decision-making. Mastering support and resistance trading requires dedication and discipline. Stay committed to your trading plan and continuously refine your techniques.
Frequently Asked Questions: FAQs About Crypto Trading Telegram Groups
What Is the Support and Resistance Trading Strategy and How Does It Work?
The support and resistance trading strategy involves identifying key price levels where an asset tends to reverse direction. These levels are used to determine entry and exit points, set stop-loss orders, and predict future price movements.
How Does Price Action Trading Help in Identifying Key Levels?
Price action trading focuses on analyzing historical price movements to identify key levels of support and resistance. By studying patterns and trends, traders can make informed decisions without relying on technical indicators.
What Are the Advantages of Using the Inside Bar Trading Strategy?
The inside bar trading strategy allows traders to identify potential reversals or continuations in price movements by observing the formation of an inside bar, which indicates a period of consolidation and potential breakout.
How Do Key Levels Influence Price Action Trading?
Key levels, such as support and resistance, play a crucial role in price action trading by highlighting areas where the price is likely to react. Traders use these levels to anticipate market movements and make strategic decisions.
What Is the Bar Combo Trading Strategy and How Can It Be Used?
The bar combo trading strategy combines multiple bar patterns, such as inside bars and pin bars, to identify high-probability trading setups. This strategy helps traders capitalize on potential breakouts or reversals.
What Happens When the Price Breaks Through Support or Resistance Levels?
When the price breaks through support or resistance levels, it often indicates a significant shift in market sentiment. A break above resistance suggests bullish momentum, while a break below support indicates bearish momentum.
How Can Fibonacci Levels Be Used as a Support and Resistance Indicator?
Fibonacci levels can be used as a support and resistance indicator by identifying potential reversal points based on key Fibonacci retracement and extension levels. These levels help traders anticipate where the price may find support or resistance, enhancing their trading strategies.
How Does the Use of Support and Resistance Strategy Help Traders Make Better Trading Decisions?
The use of support and resistance strategy helps traders by providing key price levels where the market is likely to reverse or pause. This information enables traders to make more informed decisions about entry and exit points, improving their overall trading performance and risk management.
Join the CScalp Trading Community
Join our official trader's chat. Here you can communicate with other scalpers, find trading soulmates and discuss the market. We also have an exclusive chat for crypto traders!
Don't forget to subscribe to our official CScalp news channel, use trading signals and get to know our bot.
If you have any questions, just contact our platform's support via Telegram at @CScalp_support_bot. We will respond in a matter of seconds.
You can also visit our Discord channel and subscribe to the CScalp TV YouTube channel.
JOIN OUR CHAT
