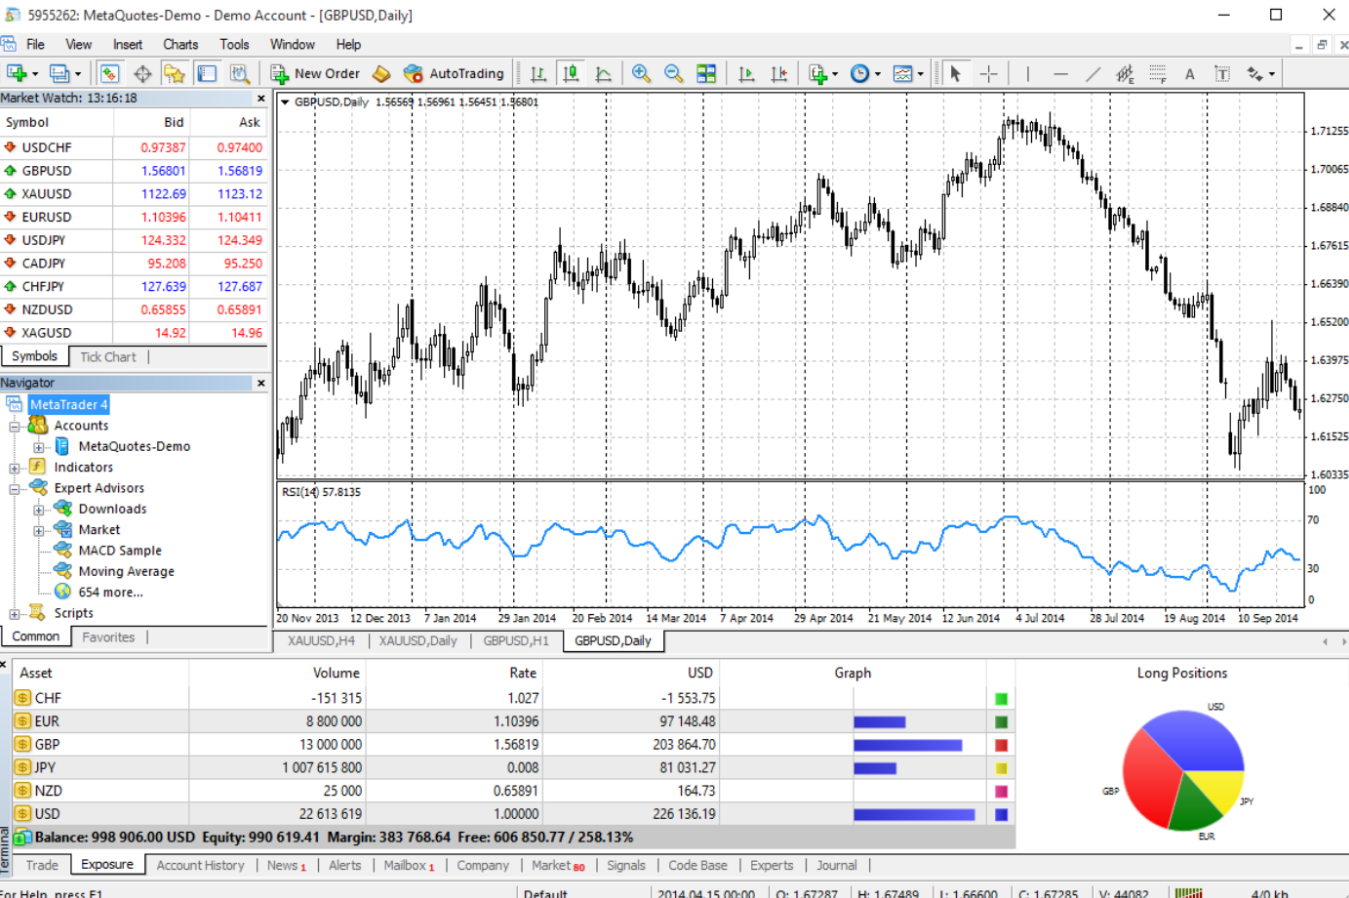
MetaTrader 4 (MT4) is a globally recognized trading platform, celebrated for its advanced charting tools. These tools offer a comprehensive solution for technical analysis and trading, enabling traders to make informed decisions. In this article, we will delve into the features of MT4 charting tools and provide tips for enhancing your trading experience.

The Fundamentals of MT4 Charting Tools
MT4 charting tools are designed to facilitate market trend analysis, pinpoint trading opportunities, and guide trading decisions. These tools encompass various chart types, drawing tools, and customization options.
Chart Types in MT4
MT4 provides three primary chart types: line charts, bar charts, and candlestick charts. Each chart type offers a unique visualization of price movements, enabling traders to analyze market trends from different angles.
Line Charts
Line charts, the most straightforward chart type, represent closing prices over a specific period. They are instrumental in identifying overarching price trends.
Bar Charts
Bar charts offer more detailed information, including the opening, closing, high, and low prices for each period. They are valuable for identifying price patterns and potential reversal points.
Candlestick Charts
Candlestick charts provide the same information as bar charts, but in a more visually appealing format, as they show the low and high prices for the selected time period. They are widely used to identify price patterns and trading signals.
Drawing Charting Tools in MT4
MT4 provides a variety of drawing tools that can help you analyze price movements and identify trading opportunities. These tools include trend lines, channels, Fibonacci retracements, and more.
Trend Lines
Trend lines are used to identify and visualize trends. They can be drawn above, below, or through the price data, depending on the trend direction.
MT4 Channels
Channels are used to identify trading ranges. They consist of two parallel trend lines that contain the price movements.
Fibonacci Retracements
Fibonacci Retracements are used to identify potential reversal points. They are based on the Fibonacci sequence, a mathematical concept that describes certain patterns in nature.
MT4 Chart Setup and Personalization
MT4 allows you to customize your charts to suit your trading style. This section will guide you through the process of setting up and personalizing your MT4 charts.
Chart Setup
Setting up your MT4 chart involves selecting the chart type, adjusting the time frame, and adding any necessary drawing tools or custom indicators.
Selecting the Chart Type
To select the chart type, click on the "Charts" menu, then select "Bar Chart", "Candlestick Chart", or "Line Chart". You can also use the toolbar buttons for quick access.
Adjusting the Time Frame
To adjust the time frame, click on the "Periods" toolbar or select "Periodicity" from the "Charts" menu. MT4 offers nine timeframes, ranging from one minute to one month.
Adding Drawing Tools or Custom Indicators
To add drawing tools or custom indicators, select "Insert" from the menu, then choose the desired tool or indicator. You can also use the "Line Studies" toolbar for quick access to the drawing tools.
Chart Personalization
Personalizing your MT4 chart involves adjusting the colors, enabling the grid and volumes, and saving your chart settings as a template.
Adjusting the Colors
To adjust the colors, right-click on the chart, select "Properties", then choose the "Colors" tab. You can change the colors of the background, foreground, grid, and more.
Enabling the Grid and Volumes
To enable the grid, select "Grid" from the "Charts" menu or click on the "Grid" toolbar button. To enable the volumes, select "Volumes" from the "Charts" menu or click on the "Volumes" toolbar button.
Saving Your Chart Settings as a Template
To save your chart settings as a template, right-click on the chart, select "Template", then choose "Save Template". You can then apply this template to other charts for a consistent trading experience.
Tips and Tricks for Better Trading with MT4 Charting Tools
MT4 charting tools are powerful, but they can be even more effective when used correctly. Here are some tips and tricks for better trading with MT4 charting tools.
Use Multiple Timeframes
Using multiple timeframes can provide a more comprehensive view of the market. For example, you can use a longer timeframe to identify the overall trend and a shorter timeframe to find optimal entry and exit points.
Combine Different Types of Indicators
Combining different types of indicators can improve the accuracy of your trading signals. For example, you can use a trend indicator to identify the direction of the trend and a momentum indicator to confirm the strength of the trend. To learn more about using indicators in MT4, we recommend you read our article, “The Best MT4 Indicators for Trading.”
Customize Your Charts
MT4 allows you to customize your charts to suit your trading style. You can change the colors, add custom indicators, and save your chart settings as a template for future use.
Practice with a Demo Account
Before trading with real money, practice with a demo account to familiarize yourself with the MT4 charting tools and develop your trading strategy.
Master MT4 Charting to Enhance Your Trading Experience
MT4 charting tools offer a comprehensive solution for technical analysis and trading, providing traders with valuable insights into market trends and potential trading opportunities. With various chart types, drawing tools, and customization options, MT4 empowers traders to tailor their charts to suit their trading styles and strategies.
By using multiple timeframes, combining different types of indicators, and practicing with a demo account, traders can optimize the effectiveness of MT4 charting tools and make well-informed trading decisions. Whether you are a beginner or an experienced trader, mastering MT4 charting tools can be a game-changer in your trading journey, leading to improved trading performance and profitability. Happy trading!
Related article: MT4 Platform vs. CScalp: Which One to Choose


