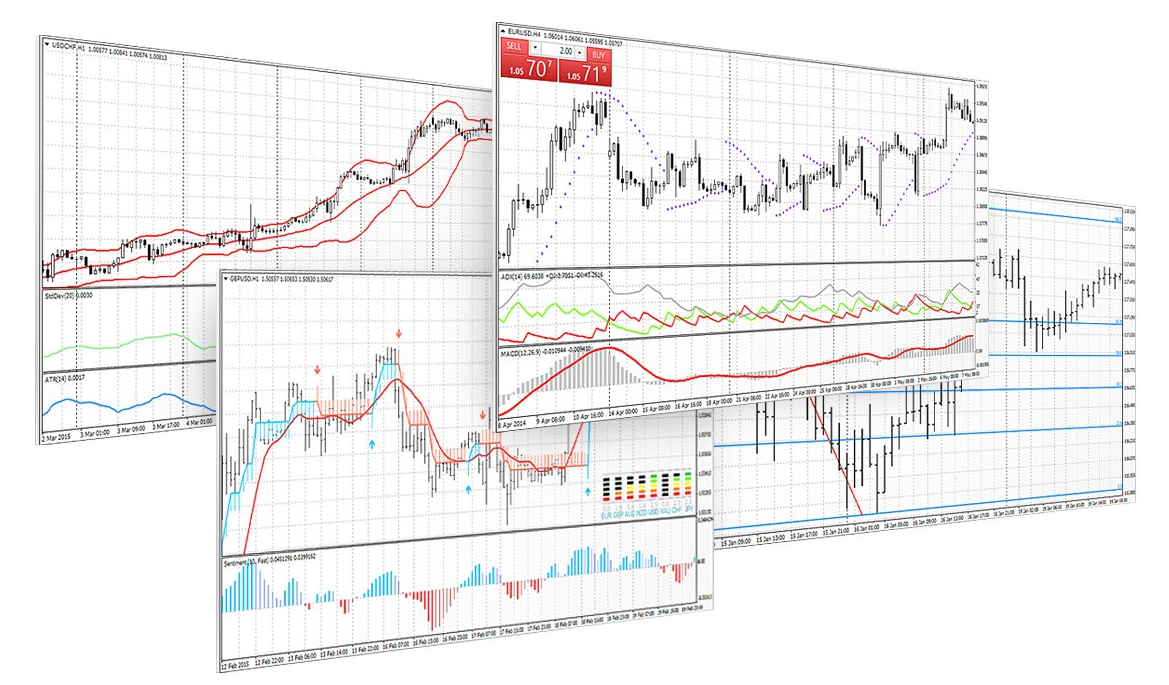
Trading in the financial markets is a complex task that requires a deep understanding of market trends and the ability to make quick decisions. One of the tools that traders use to navigate these challenges is technical indicators. These are statistical measures that provide insights into market trends and potential trading opportunities. This article will explore the best MT4 indicators for trading and how to use them effectively.

Understanding Technical Indicators
Technical indicators are mathematical formulas that utilize data from a security or contract, such as price, volume, or open interest, to show insights into market trends. By providing a different perspective on the market, they help traders predict future price movements, identify trading opportunities, and make informed trading decisions.
Technical indicators are particularly useful for:
- Identifying trends: Indicators can help traders identify the direction of market trends, enabling them to align their trading strategies accordingly.
- Generating trading signals: Indicators can generate buy and sell signals, guiding traders on when to enter or exit a trade.
- Confirming other technical analysis tools: Indicators can be used to confirm the signals generated by other technical analysis tools, increasing the reliability of your trading decisions.
MT4 Technical Indicator Options
MT4 offers over 30 built-in indicators, and traders can also download thousands of custom indicators from the internet or create their own using the MQL4 programming language.
The benefits of MT4's extensive technical indicator options include:
- Flexibility: With a wide range of indicators to choose from, traders can select the ones that best suit their trading style and strategy.
- Customization: You can customize the parameters of the indicators to fine-tune their analysis and improve the accuracy of their trading signals.
- Automation: Users of MT4 can use indicators to automate their trading, reducing the emotional stress of trading and allowing them to focus on strategy development.
Also, the platform also offers a variety of charting tools, which you can use in conjunction with the indicators to enhance your trading. Check out our article on MT4 titled “Trading with MT4 Charting Tools: All You Need to Know” to dive into the many charting features offered on the platform.
Below you will find our selection of the top five technical indicators that you can use to enhance your trading experience.
The 5 Best MT4 Indicators for Trading
While there are many technical indicators available on MT4, some have proven to be more effective and reliable than others. After consulting the opinions of traders of various levels of experience and from around the world, we have selected the following:
Moving Averages (MA)
Moving Averages (MA) is a trend-following indicator that smooths out price data to create a line that traders can use to identify the direction of a trend. Traders often use several MAs with different time frames and generate signals when these lines cross. For instance, a bullish signal is generated when a shorter-term MA crosses above a longer-term MA, indicating an upward trend.
Parabolic SAR
The Parabolic SAR (Stop and Reverse) is a trend reversal indicator that provides potential entry and exit points. When the price is above the Parabolic SAR, it indicates a downtrend, and when the price is below the Parabolic SAR, it indicates an uptrend. Traders often use this indicator to set trailing stops.
Average Directional Movement Index (ADX)
The ADX is a tool used by advanced technical analysts to measure the strength of a trend. It doesn't indicate the direction of the trend but shows how strong the current trend is. Values above 25 generally suggest a strong trend, while values below 20 indicate a weak trend.
Bollinger Bands
Bollinger Bands comprise a centerline (which represents a moving average) and two outer bands positioned at standard deviations from the centerline. When the price is close to the upper band, it indicates that the asset is overbought, and when it's near the lower band, it suggests that it is oversold. Bollinger Bands are useful for identifying trading ranges and potential trend reversal signals.
Stochastic Oscillator
The Stochastic Oscillator serves as a momentum indicator, contrasting a specific closing price of a security with a range of its prices over a designated timeframe. The oscillator moves between zero and 100 and is considered overbought above 80 and oversold below 20. Traders often look for bullish and bearish divergences to predict potential price reversals.
Making the Most of MT4’s Technical Indicators
Technical indicators play a crucial role in navigating the complexities of financial markets and making well-informed trading decisions. MT4 stands out as a powerful platform offering an array of technical indicators that cater to traders of all levels. Its flexibility, customization options, and automation capabilities make it a go-to choice for traders seeking a comprehensive trading experience.
By mastering these indicators and leveraging MT4's capabilities, you can gain valuable insights into market trends and potential trading opportunities, leading to more successful and profitable trading journeys. With a solid understanding of technical indicators and the versatility of MT4, you can elevate your trading strategies to new heights and achieve greater success in the dynamic world of financial markets.
If you have already decided and want to start trading with MT4, you can check out our recent guide that covers everything you need to know about how to download MT4 and start trading.


