
Effective RSI Trading Strategy for Crypto Trading
The RSI trading strategy is a popular approach among cryptocurrency traders. In this article, you will discover how to effectively use the Relative Strength Index (RSI) in your crypto trading strategies. We’ll cover the fundamentals of RSI, including how to identify overbought and oversold levels, explore advanced techniques such as divergence trading and incorporating RSI crossovers, and highlight the risks and limitations of RSI trading.
Attention! This article is for informational purposes only and does not contain recommendations or calls to action.
The review has been prepared by the CScalp terminal team. You can get CScalp by leaving your e-mail in the form below.


RSI Trading Strategy Overview
RSI trading is a popular strategy among cryptocurrency traders looking to capitalize on market trends. It involves using the RSI indicator to identify overbought and oversold conditions, indicating potential price reversals. This strategy can be applied in various timeframes to meet your specific needs.
What Is the Relative Strength Index?
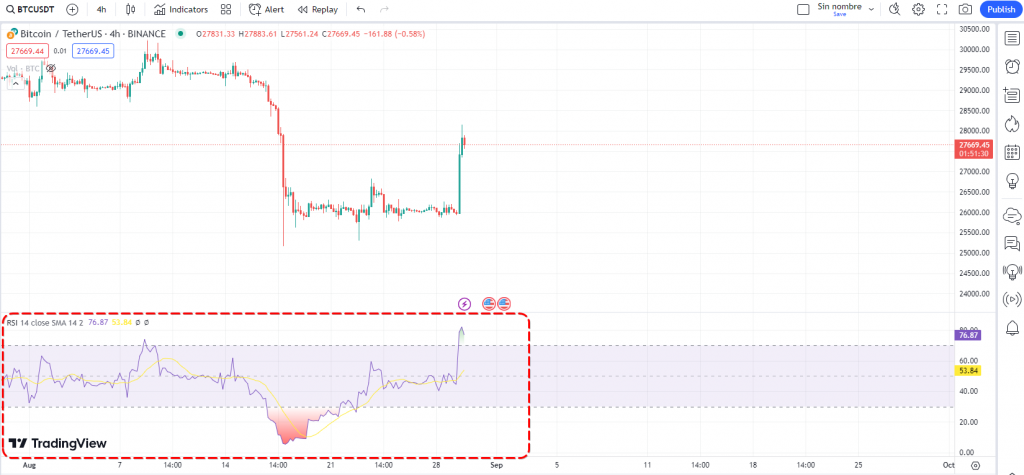
The Relative Strength Index is a momentum oscillator that measures the speed and change of price movements in a given cryptocurrency. Ranging from 0 to 100, the RSI provides insights into the strengths and weaknesses of a market trend.
- RSI above 70 indicates an overbought condition, suggesting a potential trend reversal to the downside.
- RSI below 30 indicates an oversold condition, pointing to a potential trend reversal to the upside.
By understanding how the RSI works, you can effectively time entries and exits, maximize profit potential, and minimize risks in your cryptocurrency trading endeavors.
The Fundamentals of RSI Trading Strategy
The Relative Strength Index (RSI) is a tool to identify potential trade entry and exit points. By understanding the fundamentals of using RSI, you can make informed decisions in your crypto trading activities. This section delves into three key aspects of RSI trading strategy: utilizing RSI for trade entry and exit, determining overbought and oversold levels, and identifying the best RSI indicator for crypto trading.
Utilizing RSI for Trade Entry and Exit Points
One of the primary purposes of RSI is to help you determine optimal trade entry and exit points. When the RSI value is above 70, it indicates that the market is overbought, suggesting a potential reversal to the downside. This could be an opportunity to enter short positions. Conversely, when the RSI value is below 30, it suggests an oversold market condition, indicating a potential reversal to the upside, which you can exploit for long positions.
Determining Overbought and Oversold Levels
Determining overbought and oversold levels is crucial in the RSI trading strategy. When the RSI moves above 70, it indicates an overbought condition, suggesting that the asset price may be due for a downward correction. Use this signal to adjust your trading strategy accordingly, such as taking profits or considering short positions. Conversely, when RSI drops below 30, it signifies an oversold condition, indicating that the asset price may be ripe for an upward price correction. Utilize this signal to plan your entry for long positions or consider buying opportunities.
Best RSI Indicator Settings for Crypto Trading
Choosing the best RSI indicator for crypto trading is essential for accurate analysis. While the default setting for RSI is often 14 periods, you can customize the RSI period based on the timeframe you are trading. For shorter timeframes, such as 5-minute or 15-minute charts, a lower RSI period, such as 9, may provide more responsive signals. On the other hand, longer timeframes, like daily or weekly charts, may benefit from a higher RSI period, such as 21 or 30, to filter out market noise and produce more reliable signals. It is crucial to experiment and find the RSI period that aligns best with your preferred crypto trading strategies.
Fine-tuning RSI Settings for Different Timeframes
When implementing the RSI trading strategy, it is essential to adjust the settings of the Relative Strength Index indicator based on the timeframe you are trading. Fine-tuning the RSI settings allows for better accuracy and effectiveness in identifying potential trade opportunities.
Advanced RSI Trading Techniques
In the world of cryptocurrency trading, advanced techniques can provide valuable insights and enhance your trading strategy. This section explores three powerful ways to leverage the Relative Strength Index (RSI) and take your trading skills to the next level.
Divergence Trading with RSI
Divergence occurs when the price of a cryptocurrency and the RSI indicator move in opposite directions. It suggests a potential shift in the market trend.
- For a bearish divergence, look for a higher high in the price chart but a lower high in the RSI. This indicates selling pressure building up and can be an early warning sign of a downward price reversal.
- A bullish divergence occurs when the price makes a lower low while the RSI forms a higher low. This signals buying pressure increasing and a potential upward trend reversal.
Incorporating RSI Crossovers
RSI crossovers can provide signals to identify potential trend changes. Keep an eye on two key levels: 50 and 30. Here’s how RSI crossovers work:
- When the RSI crosses above the 50 level, it indicates a potential bullish trend. It suggests a shift from selling pressure to buying pressure and can be an opportune time to consider long positions.
- Conversely, when the RSI crosses below the 50 level and falls to or below 30, it could indicate a bearish trend. Selling pressure may be increasing, presenting an opportunity for short positions.
RSI Failures and Reversal Signals
An RSI failure occurs when the price of a cryptocurrency continues to rise while the RSI indicator decreases. This phenomenon can indicate a potential trend reversal.
If the RSI fails to make a new high while the price continues to climb, it suggests that buying pressure is weakening. A price correction or reversal could be imminent.
It’s important to exercise caution when relying solely on RSI trading techniques, as they can generate false signals. Consider using these techniques in conjunction with other technical indicators, such as moving averages, Bollinger Bands, and stochastic oscillators, for added confirmation. Our CScalp Discord server is a great place to find more experienced traders willing to help you in this process.
Combining RSI Trading Strategy with Other Technical Indicators
When it comes to maximizing the effectiveness of your RSI trading strategy, combining the Relative Strength Index with other technical indicators can provide valuable confirmation and enhance your decision-making process. Here are three popular ways to do so:
Using RSI in Conjunction with Moving Averages
Moving averages are widely used in technical analysis to identify trends and potential support and resistance levels. By combining RSI with moving averages, you can gain additional insight into the market’s momentum and trend direction.
When the RSI crosses above a moving average, especially the longer-term ones like the 50-day or 200-day moving averages, it can signal a bullish trend. Conversely, when the RSI crosses below a moving average, it may indicate a bearish trend.
Learn more: Momentum Trading Strategies: How to Implement Them
Enhancing RSI Signals with Bollinger Bands
Bollinger Bands are volatility-based indicators that consist of an upper band, a lower band, and a middle band (usually a simple moving average). These bands expand and contract based on market volatility. When combined with RSI, Bollinger Bands can help identify potential overbought or oversold conditions.
For instance, if the RSI reaches or exceeds the upper Bollinger Band, it may indicate that the market is overbought, potentially signaling a reversal or correction. Conversely, if the RSI falls to or below the lower Bollinger Band, it may suggest that the market is oversold, possibly indicating a buying opportunity.
Using RSI With Stochastic Oscillator
The stochastic oscillator is a momentum indicator that compares a particular closing price to its price range over a defined period. When combined with RSI, it can provide additional confirmation and help filter out false signals.
By using both indicators together, traders can look for convergence or divergence between the RSI and the stochastic oscillator. When both indicators show overbought conditions and begin to cross downwards, it may indicate a stronger signal for a potential trend reversal.
Remember, the goal of combining RSI with other technical indicators is to increase the reliability of the trading signals. It is essential to experiment, backtest, and fine-tune your strategy to find the optimal combination that works best for your trading style and the specific cryptocurrency market you are trading.
Real-life Examples of RSI Trading in Cryptocurrencies
Let’s explore a couple of scenarios:
Example 1: Bitcoin (BTC) RSI Divergence
During a bullish trend in Bitcoin, the RSI indicator can help identify potential reversal points. Suppose Bitcoin reaches a new high, but the RSI fails to surpass its previous peak. This bearish divergence could signal a potential trend reversal and serve as a sell signal for traders using the RSI trading strategy.
Example 2: Ethereum (ETH) RSI Breakout
When Ethereum is trading in a range-bound market, the RSI can help identify breakout opportunities. If the RSI breaks above the overbought level (e.g., 70), it could indicate a potential bullish breakout. Traders using the RSI strategy may consider entering a long position to capitalize on the anticipated uptrend.
These real-life examples demonstrate how the RSI trading strategy can be applied to cryptocurrencies, providing traders with potential opportunities to profit from market movements.
Risks and Limitations of RSI Trading Strategy
Potential False Signals and Whipsaws
False signals occur when the RSI indicates a trade entry or exit point, but the market doesn’t follow through as expected. This can lead to losses if you solely rely on RSI signals without considering other factors such as market fundamentals or news events. Whipsaws, on the other hand, refer to sudden and unexpected reversals in price direction, which can cause trades based on RSI signals to quickly turn unprofitable.
To mitigate the risk of false signals and whipsaws, you should consider using additional confirmation indicators or techniques. Combining RSI with other technical indicators can provide a more comprehensive analysis and help filter out potential false signals. Additionally, incorporating risk management strategies such as setting stop-loss orders and taking partial profits can help minimize losses in volatile market conditions.
The Crypto Market and RSI Trading Strategies
Throughout this article, we’ve explored the multifaceted applications of RSI, from basic principles like identifying overbought and oversold levels to advanced tactics like divergence trading and RSI crossovers.
The integration of RSI with other technical indicators further enhances its effectiveness, allowing you to validate signals and refine strategies. However, it’s crucial to remember that no single strategy is infallible. The inherent volatility of cryptocurrencies means you must be aware of the risks and limitations of relying solely on RSI. False signals and market anomalies can lead to losses, underscoring the need for a comprehensive approach that includes risk management and a thorough understanding of market fundamentals.
As with any trading strategy, success with RSI requires patience, practice, and ongoing learning. By combining the Relative Strength Index with a balanced and informed trading approach, you can navigate the crypto markets with greater confidence and efficiency, aiming for successful and sustainable trading outcomes.
Related article: Master the MACD Trading Strategy for Success in the Crypto Market
Join the CScalp Trading Community
Join our official trader's chat. Here you can communicate with other scalpers, find trading soulmates and discuss the market. We also have an exclusive chat for crypto traders!
Don't forget to subscribe to our official CScalp news channel, use trading signals and get to know our bot.
If you have any questions, just contact our platform's support via Telegram at @CScalp_support_bot. We will respond in a matter of seconds.
You can also visit our Discord channel and subscribe to the CScalp TV YouTube channel.
JOIN OUR CHAT