
M and W Trading Patterns: How to Use Them
Candlestick trading includes the use of W and M patterns for predicting market trends. In this comprehensive guide by CScalp, we explore the structure, characteristics, and practical application of M pattern trading and W pattern trading.
Attention! This article is for informational purposes only and does not contain recommendations or calls to action.
The review has been prepared by the CScalp terminal team. You can get CScalp by leaving your e-mail in the form below.

What Is the W Pattern in Trading?
The W pattern also called the double bottom pattern, is a bullish reversal signal. It is used in technical analysis for identifying potential turning points in bearish markets. It is formed by two lows separated by a peak, indicating a market attempting to find a bottom twice, signaling a shift towards bullish momentum.

The W pattern’s effectiveness lies in its distinct features: the depth of the lows, the time interval between them, and the breakout point above the peak. Traders often seek symmetry between the lows and a notable increase in trading volume as the pattern completes. In real-world scenarios, it signals considering long positions, such as entering a long position in a cryptocurrency pair expecting a bullish reversal.
What Is the M Pattern in Trading?
The M pattern, or double top, is a bearish reversal indicator forming after an upward trend. It is characterized by two peaks at a similar price level, separated by a trough, suggesting a shift to a bearish trend.
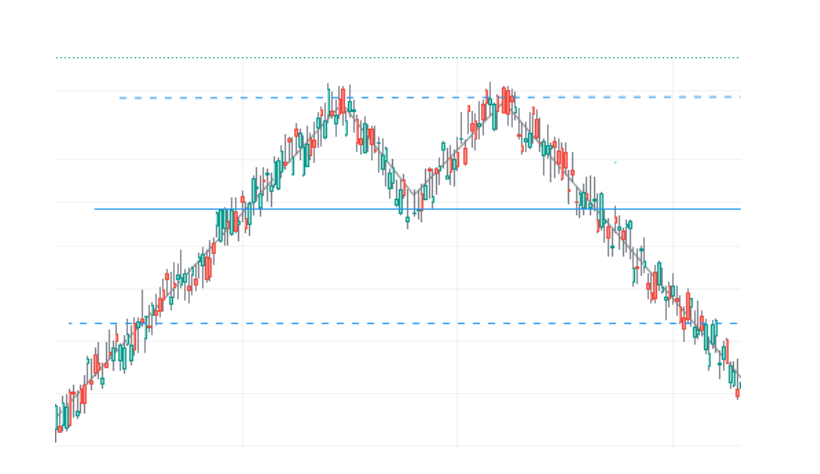
Identifying an M pattern involves observing the price peaks and intervening lows, ensuring the peaks are close in time and price, with decreasing volume indicating diminishing bullish momentum. A common strategy is entering a short position after the price falls below the trough level, often with a Stop-Loss order above the second peak.
Check out other patterns on our blog: Mastering the Head and Shoulders Trading Pattern

W Patterns versus M Patterns in Trading: Key Differences
Understanding the distinctions between W and M patterns is essential for traders. These patterns, while structurally similar, have unique attributes and contexts of formation that significantly impact how they are interpreted and used in trading strategies.
- Formation Context: The W trading pattern (or double bottom) typically materializes at the bottom of a downtrend and signals a potential shift to an uptrend. This pattern reflects a scenario where the market, after a period of bearish momentum, is attempting to reverse into bullish territory. It is characterized by two consecutive lows with a moderate peak in between. The M trading pattern (or double top) usually occurs during an uptrend and indicates a potential reversal to a downtrend. It is marked by two consecutive highs with a trough in between, suggesting a weakening of the preceding bullish momentum.
- Trading Implications: The emergence of a W pattern, following a bearish trend, often leads traders to consider long positions, anticipating a bullish reversal. This pattern suggests the selling pressure is diminishing, and buyers are starting to gain control. Conversely, the formation of an M pattern in an uptrend may prompt traders to think about short positions, anticipating a bearish reversal. This indicates that buyers are losing momentum, and sellers may be taking over.
- Confirmation Needs: The W pattern might require additional indicators to confirm the bullish reversal, given that it forms in a bearish context where traders may be wary of false signals. In contrast, an M pattern, forming in a bullish context, may require slightly less confirmatory evidence, as it aligns with the natural ebb and flow of market trends. However, both patterns benefit from the use of additional technical indicators, such as volume analysis, moving averages, or momentum indicators like RSI or MACD, to strengthen the validity of the trading signals they provide.
Effective Trading Strategies Using W and M Patterns
Developing trading strategies that incorporate W and M chart patterns can significantly enhance the precision and success of a trader’s market interventions. These patterns, integral to technical analysis, offer insightful cues about potential market reversals.
Timing Entries and Exits with W and M Patterns
The key to leveraging W and M patterns in trading lies in accurately timing entry and exit points. For W patterns, which signal a bullish reversal at the bottom of a downtrend, the ideal entry point is often after the price breaks above the peak that separates the two lows. This breakout indicates that the market has absorbed the selling pressure and is starting to move upwards. A common exit strategy is to set a profit target near previous resistance levels or capitalize on potential uptrend continuation.
Conversely, with M patterns, indicative of a bearish reversal during an uptrend, traders should consider entering a short position after the price breaks below the trough between the two peaks. This break signifies that the bullish momentum is waning, and a downtrend may be imminent. Exit points for M patterns can be strategically placed near subsequent support levels or determined by a predetermined risk-reward ratio.
Integrating W and M Patterns with Other Technical Indicators
To enhance the effectiveness of W and M pattern trading, we recommend integrating other technical indicators. This helps in confirming the pattern and refining trade execution.
- Volume Analysis: Confirming a pattern with volume analysis can be powerful. For instance, an increasing trade volume on the breakout of a W pattern provides additional confirmation of bullish momentum. Similarly, a spike in volume during the breakdown of an M pattern can confirm bearish intent.
- Moving Averages: Utilizing moving averages helps in understanding the trend context. A W trading pattern forming above a key moving average like the 50-day or 200-day line can reinforce the bullish signal. In contrast, an M pattern below these averages may strengthen the bearish outlook.
- Momentum Oscillators: Tools like RSI or MACD are beneficial in identifying momentum shifts that precede pattern formations. Divergences between these indicators and price action can serve as early warnings of potential reversals.
Risk Management in W Pattern Trading and M Pattern Trading
Effective risk management is essential when trading W and M patterns:
- Stop-Loss Orders: Placing Stop-Loss orders just below the lowest low of a W pattern or above the highest high of an M pattern can limit potential losses if the market moves against the anticipated direction.
- Position Sizing: Allocating only a portion of the total trading capital to a single pattern-based trade helps in diversifying risk.
- Adaptability: Traders should remain adaptable and ready to exit trades if additional market analysis contradicts the initial pattern reading.
W Pattern Trading and M Pattern Trading – Conclusion
Mastering W and M pattern trading is a vital aspect of technical analysis, providing traders with powerful tools for market prediction and strategy development. By understanding these patterns, incorporating them into a comprehensive trading strategy, and practicing disciplined risk management, you can significantly enhance your effectiveness in the cryptocurrency market.
Related article: Bear Traps in Trading: How to Identify and Overcome Them
Join the CScalp Trading Community
Join our official trader's chat. Here you can communicate with other scalpers, find trading soulmates and discuss the market. We also have an exclusive chat for crypto traders!
Don't forget to subscribe to our official CScalp news channel, use trading signals and get to know our bot.
If you have any questions, just contact our platform's support via Telegram at @CScalp_support_bot. We will respond in a matter of seconds.
You can also visit our Discord channel and subscribe to the CScalp TV YouTube channel.
JOIN OUR CHAT