Candlestick Trading: Master Candlestick Chart Pattern Recognition for Your Day Trading Strategies
Understanding candlestick patterns in financial markets is similar to deciphering the language of price movements. It’s not just about red and green bars on a candlestick chart; it’s about recognizing the signals they convey. Whether you’re a novice trader looking to grasp the technical analysis basics or already have the expertise, CScalp’s comprehensive guide is designed to provide you with insights into candlestick trading.
Attention! This article is for informational purposes only and does not contain recommendations or calls to action.
The review has been prepared by the CScalp terminal team. You can get CScalp by leaving your e-mail in the form below.
Introduction to Candlestick Trading
Let’s start with the definition of candlestick trading. Candlestick trading is a technique that allows traders to make informed decisions based on price movements. As part of technical analysis, this approach relies on interpreting the visual representation of market data through candlestick patterns. These patterns, formed by the open, close, high, and low prices within a specific timeframe, provide valuable insights into market sentiment and potential future trends.

Freepik
The Benefits of Using Trading Candlestick Patterns
Why should intraday traders pay close attention to candlestick patterns? The answer lies in their effectiveness. Pattern analysis offers a clear way to analyze market behavior. They can help traders identify trend reversals, bullish or bearish signals, and potential entry or exit points. By understanding candles, traders can gain an advantage in their decision-making process.
Furthermore, candlestick patterns provide a universal language for traders across various financial markets, including stocks, Forex, commodities, CFDs, and cryptocurrencies. This versatility makes them an indispensable tool in a trader’s arsenal, allowing for adaptability in different market conditions.
Let’s delve deeper into the fundamentals of candlestick patterns.
Understanding Candlestick Patterns in Trading
Candlestick patterns are the building blocks of technical analysis in trading. These patterns provide a visual representation of price movements over a specific time frame, typically in the form of candlesticks on a chart. Understanding these patterns is crucial for intraday trading, as they serve as valuable indicators of market sentiment and potential future price movements.
A candlestick consists of two main parts: the body and the wick (shadow). The body represents the price range between the opening and closing prices during the selected time period. If the closing price is higher than the opening price, the candlestick is usually colored green or white, signifying a bullish (positive) sentiment. Conversely, if the closing price is lower than the opening price, the candlestick is often red or black, indicating a bearish (negative) sentiment.
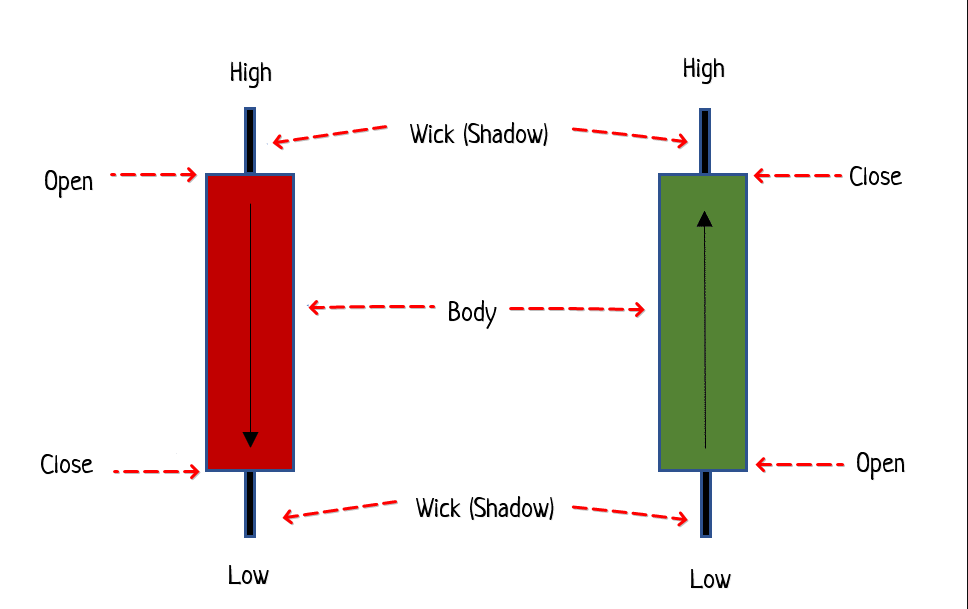
Candlestick structure
The shadows, which look like short or long tails, represent the high and low prices during the same time frame. The upper wick extends from the top of the body to the highest price, while the lower wick extends from the bottom of the body to the lowest price.
Candlestick patterns are formed by the arrangement of these candlesticks on a chart. Each pattern conveys specific information about market behavior and potential trends. By learning to interpret these patterns, traders can make more informed decisions, identify entry and exit points, and effectively navigate the complexities of the financial markets.
The Importance of Trading Candlestick Charts
Candlestick charts hold a central role in technical analysis for traders across various financial markets. These charts offer a visual representation of price movements that go beyond the limitations of traditional bar charts or line charts. Understanding the importance of candlestick charts and using them for financial modeling is essential for traders seeking to make informed decisions and gain an edge in their trading endeavors.
- Clarity in Price Action: Candlestick charts provide a clear and concise view of price action within a specific timeframe. The visual representation of each candlestick, with its open, close, high, and low prices, allows traders to quickly grasp market dynamics and trends.
- Visualization of Market Sentiment: Candlestick patterns offer a way to gauge market sentiment. Bullish and bearish patterns convey whether buyers or sellers have the upper hand, aiding traders in anticipating potential trend reversals or continuations.
- Pattern Recognition and Pattern Analysis: Candlestick charts are the foundation for recognizing and interpreting candlestick patterns. These patterns, when identified accurately, can signal potential entry or exit points, helping traders make timely decisions and make money.
- Universal Applicability: Candlestick graphs are not limited to a specific asset class or market. They are widely used in stocks, Forex, commodities, cryptocurrencies, and more. This universality makes candlestick analysis a valuable skill for traders interested in investing in diverse financial markets.
- Historical Price Context: Japanese candlesticks represent a specific period of historical price data. Traders can assess how current price movements relate to past trends and patterns, providing valuable context for decision-making.
- Technical Analysis: These patterns seamlessly integrate with other technical analysis tools, such as support and resistance levels, moving averages, and oscillators, enhancing the depth and accuracy of market analysis.
How to Read and Analyze Candlestick Charts
Candlestick charts are a staple of technical analysis, providing traders with a comprehensive view of price movements and market sentiment. Learning how to read and analyze candlestick charts is an essential skill for any trader looking to make informed decisions and navigate the complexities of financial markets effectively.

Become an Expert in Candlestick Pattern Recognition
- Understanding the Candle Anatomy: Each candlestick on a chart consists of a body and a wick (or shadow). The body represents the price range between the opening and closing prices during a specific time frame. The wick’s length extends from the top and bottom of the body, indicating the high and low prices within the same period.
- Identifying Candlestick Patterns: These include common patterns like Doji, Hammer (or Inverted Hammer), and Shooting Star, each carrying distinct meanings and potential trading signals.
- Multi-Candlestick Patterns: Engulfing Patterns, Bullish Harami, Three White Soldiers, or Three Black Crows, are formed by the arrangement of multiple candlesticks and offer more robust signals.
Learn more about crypto chart patterns in our blog.
Analyzing Market Sentiment
- Trends: The sequence of candlesticks can reveal ongoing trends. An uptrend (for example, confirmed by the fundamental analysis) is characterized by a series of higher highs and higher lows, while a downtrend features lower highs and lower lows.
- Reversals: Certain candlestick patterns can signify potential trend reversals. For example, a series of bearish candlestick patterns in an uptrend may indicate a possible shift to a downtrend.
Combining Candlestick Trading with Technical Indicators
Support and Resistance: Incorporate support and resistance levels to confirm candlestick signals.
Indicators: Combine candlestick analysis with technical indicators such as moving averages, RSI, MACD, or Bollinger Bands, for added confirmation of your candlestick analysis.
Identifying Bullish and Bearish Candlestick Patterns
Bullish candlestick patterns are those that suggest a potential upward movement in price, indicating a bullish sentiment among market participants. These patterns often provide traders with opportunities to consider long or buying positions. Here are some key bullish candlestick patterns to look out for:
Hammer: A single candlestick pattern characterized by a small body with a long lower wick. It suggests that sellers attempted to drive prices lower but failed, signaling a potential reversal.
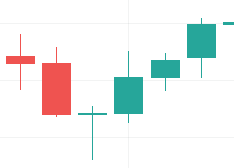
Hammer candlestick pattern
Bullish Engulfing Pattern: This two-candlestick pattern consists of a smaller bearish candle followed by a larger bullish candle. The second candlestick engulfs the first, indicating a shift from bearish to bullish movement.
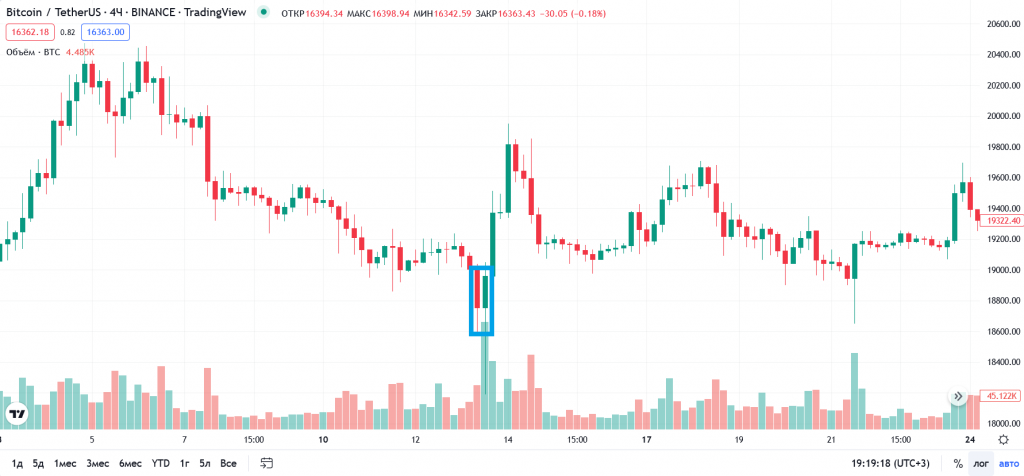
Bullish Engulfing candlestick pattern
Morning Star: A three-candlestick pattern that starts with a bearish candle, followed by a small indecisive candle (Doji or spinning top), and concludes with a bullish candle. It implies a potential trend reversal.
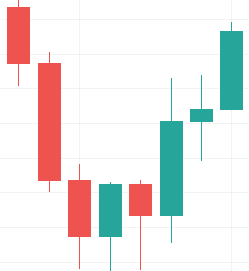
Morning Star candlestick pattern
Piercing Pattern: Comprising two candlesticks, this pattern begins with a bearish candle followed by a bullish candle that closes above the midpoint of the first candle. It suggests a possible reversal of a downtrend.
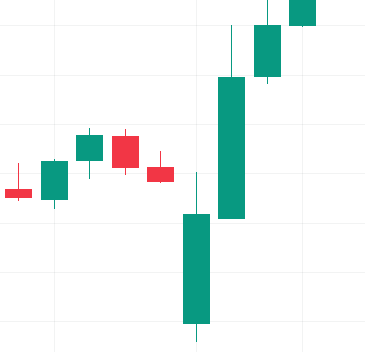
Piercing candlestick pattern
Identifying Bearish Candlestick Patterns
Bearish candlestick patterns, on the other hand, signal a potential downward movement in price, indicating a bearish sentiment. These patterns may lead traders to consider short or selling positions. Here are some key bearish candlestick patterns to recognize:
Shooting Star: A single candlestick pattern with a small body and a long upper wick. It suggests that buyers attempted to push prices higher but failed, signaling a potential reversal.
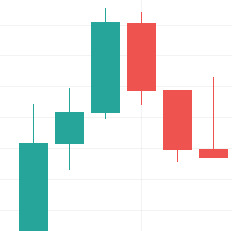
Shooting Star candlestick pattern
Bearish Engulfing Pattern: This two-candlestick pattern starts with a smaller bullish candle followed by a larger bearish candle that engulfs the first one. It indicates a shift from bullish to bearish sentiment.
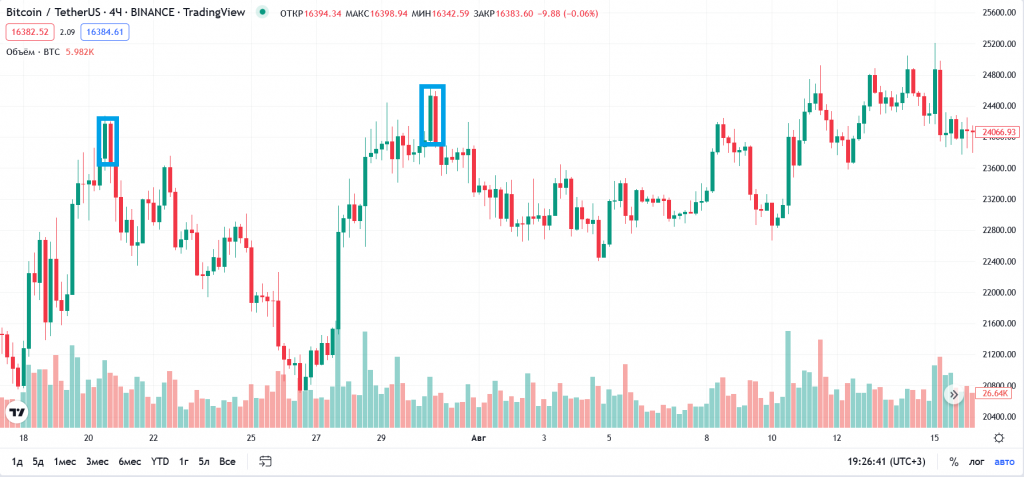
Bearish Engulfing candlestick pattern
Evening Star: A three-candlestick pattern that begins with a bullish candle, followed by a small indecisive candle (Doji or spinning top), and concludes with a bearish candle. It implies a potential trend reversal.
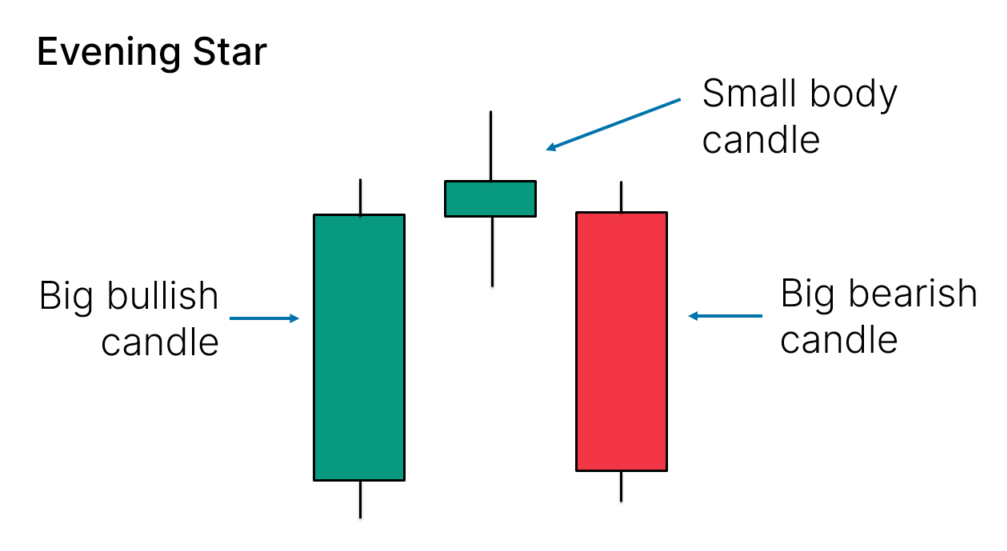
Evening Star candlestick pattern
Dark Cloud Cover: Comprising two candlesticks, this pattern starts with a bullish candle followed by a bearish candle that closes below the midpoint of the first candle. It suggests a possible reversal of an uptrend.
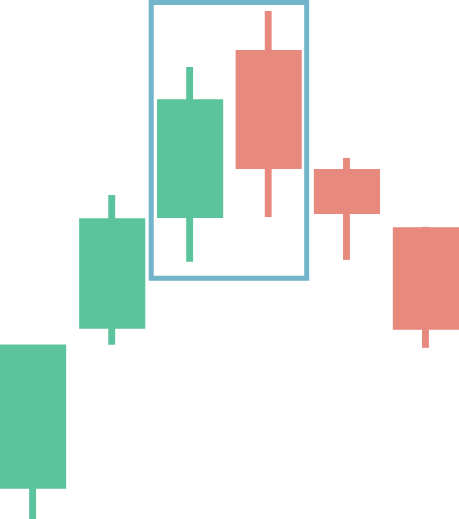
Dark Cloud Cover candlestick pattern
Learn more about popular candle patterns by reading our blog or visiting our webinar on CScalp’s YouTube channel.
Incorporating Candlestick Patterns Into Day Trading Strategies
Candlestick patterns are more than just visual indicators; they serve as a valuable component of trading strategies across various financial markets. In this section, we will explore how traders can effectively incorporate candlestick patterns into their trading strategies.
Candlestick patterns can be used in various ways within trading strategies:
Confirmation of Entry and Exit Points: Traders often use candlestick patterns to confirm potential entry and exit points for their trades. For example, a bullish candlestick pattern may reinforce a decision to enter a long position, while a bearish pattern may signal the need to exit or consider short positions.
Stop-Loss and Take-Profit Placement: Traders can use candlestick patterns to determine suitable levels for placing stop-loss and take-profit orders. These patterns can help establish more precise risk-reward ratios for trades.
Trend Identification: Candlestick patterns can assist in identifying trends, whether they are bullish or bearish. Recognizing the prevailing trend can help traders align their strategies accordingly, such as trading with the trend or looking for potential reversals.
Risk Management: Incorporating candlestick patterns into risk management strategies is crucial. Traders can adjust position sizes based on the strength of candlestick patterns or use them as early warning signals to minimize potential losses.
Combining Candles with Other Indicators: Candlestick patterns work well when combined with other technical analysis tools. Traders often use moving averages, support and resistance levels, and oscillators alongside candlestick patterns for added confirmation and accuracy.
Time Frame Selection: Traders can adapt their trading strategies by selecting specific timeframes for analyzing candlestick patterns. Short-term traders may focus on intraday patterns, while long-term investors may consider patterns on daily or weekly charts.
Combining Candlesticks and Other Technical Analysis Tools
Candlestick patterns are most effective when integrated into a broader technical analysis framework. Combining candlestick patterns with other technical indicators enhances the depth and reliability of market analysis. Here’s how traders can effectively blend candlestick patterns with technical analysis:
Support and Resistance Levels: Identifying key support and resistance levels on a price chart can reinforce the significance of candlestick patterns. Breakouts or reversals at these levels can be confirmed by corresponding candlestick patterns.
Moving Averages: Traders regularly use moving averages alongside candlestick patterns to identify trend direction and potential entry or exit points. Crossovers of moving averages and the appearance of specific candlestick patterns can provide strong trading signals.
Oscillators (RSI, MACD, etc.): Oscillators help traders gauge overbought or oversold conditions in the market. Combining oscillator signals with candlestick patterns can yield precise entry and exit signals.
Chart Patterns: Chart patterns like head and shoulders, flags, or triangles can complement candlestick analysis. When these patterns align with specific candlestick formations, traders can gain more confidence in their trading decisions.
Learn more: Flag Pattern Trading Strategies for Crypto Traders
Developing a Winning Trading Plan for Candlestick Trading
A winning trading plan is the cornerstone of a trader’s success, and integrating candlestick trading into that plan can be a powerful addition. In this section, we’ll guide you through the process of developing a comprehensive trading plan that incorporates candlestick patterns effectively.
- Define Your Trading Goals: Clearly outline your financial objectives, risk tolerance, and desired trading outcomes. Identify whether you’re a short-term or long-term trader.
- Select Suitable Timeframes: Determine the time frame(s) you’ll be trading on, such as daily, hourly, or minute charts. Your choice should align with your trading style and goals.
- Identify Tradable Assets: Decide which financial instruments you’ll focus on, whether it’s stocks, Forex pairs, commodity or cryptocurrency markets.
- Incorporate Candlestick Patterns: Specify how you’ll use candlestick patterns in your trading plan. Define the patterns you’ll prioritize and how you’ll interpret their signals.
- Risk Management Strategies: Establish risk management rules, including position sizing, Sop-Loss placement, and Take-Profit levels. Determine the maximum percentage of your trading capital you’re willing to risk on a single trade.
- Entry and Exit Criteria: Outline precise criteria for entering and exiting trades based on candlestick patterns. Define the conditions that must be met before executing a trade.
- Trading Psychology: Address the psychological aspects of trading, including discipline, patience, and managing emotions. Implement strategies to maintain a calm and rational mindset while trading.
- Record-Keeping and Analysis: Maintain a detailed trading journal to track your trades, including the candlestick patterns that influenced your decisions. Regularly review your journal to learn from your successes and mistakes.
- Backtesting and Optimization: Backtest your trading plan on historical data to assess its performance. Make necessary adjustments and optimizations based on the results.
- Continuous Learning: Commit to ongoing education and improvement. Stay updated on candlestick patterns and market developments to refine your trading plan over time.
By following these steps and tailoring them to your unique trading style and preferences, you can develop a winning trading plan that leverages candlestick patterns as a valuable tool in your trading arsenal.
Common Mistakes to Avoid in Candlestick Trading
While candlestick patterns offer valuable insights, traders must be aware of common pitfalls to avoid. Understanding these mistakes can help you navigate the intricacies of candlestick trading effectively.
- Overtrading: Avoid the temptation to trade excessively based solely on candlestick patterns. Stick to your trading plan and avoid impulsive decisions.
- Neglecting Risk Management: Failing to set stop-loss orders or risking too much capital on a single trade can lead to substantial losses. Always prioritize risk management.
- Ignoring Confirmation: Relying solely on candlestick patterns without confirmation from other technical indicators can be risky. Use additional tools to validate your trading decisions.
- Chasing Losses: Trying to recover losses quickly by increasing trade sizes or frequency can amplify losses. Stick to your plan and avoid chasing losses.
- Lack of Patience: Be patient and wait for high-probability setups based on candlestick patterns. Avoid forcing trades in unfavorable market conditions.
- Failing to Adapt: Market conditions change, and so should your trading strategy. Don’t be rigid; be prepared to adjust your approach when necessary.
- Emotional Trading: Letting emotions drive your decisions can lead to impulsive actions and losses. Stick to your plan and maintain discipline.
- Not Backtesting: Neglecting to backtest your trading strategy with historical data can result in poor performance. Always validate your plan through backtesting.
How to Set Up Your Candlestick Trading Workspace
Creating an efficient trading workspace is essential for effective candlestick trading. Here’s how to set up your workspace for optimal performance:
Choose a Reliable Trading Platform: Select a reputable trading platform like CScalp that offers candlestick charting tools and analysis features.
Customizable Charts: Configure your candlestick charts to display the timeframes and assets you prefer to trade.
Indicator Selection: Add technical indicators such as moving averages, RSI, and MACD to complement your candlestick analysis.
Multiple Screens: If possible, use multiple screens to monitor different timeframes and assets simultaneously, allowing for better decision-making.
Economic Calendar: Stay informed about economic events and news releases that may impact your trades.
Trading Journal Software: Utilize a free online Trading Diary by CScalp to record your trades, track performance, and identify areas for improvement.
Ergonomic Setup: Ensure your workspace is ergonomically designed for long trading hours to reduce physical strain.
Backup Power and Internet: Have backup power sources and internet connections in case of outages during critical trading moments.
Stay Organized: Keep your workspace clutter-free and organized, allowing you to focus on your trading activities.
Candlestick Trading – Conclusion
Mastering candlestick trading requires dedication, education, and discipline. By internalizing the key takeaways mentioned here and consistently applying them, you can navigate the complexities of financial markets with confidence and increase your chances of achieving your trading goals. Candlestick patterns are just one piece of the puzzle, but when used wisely, they can be a powerful tool in your trading arsenal.
Join CScalp’s community and start driving your achievements in the trading world. Our platform provides the resources and support you need to elevate your trading experience and cultivate your path to success in candlestick trading. Join us now and start your journey towards becoming a skilled candlestick trader.
Join the CScalp Trading Community
Join our official trader's chat. Here you can communicate with other scalpers, find trading soulmates and discuss the market. We also have an exclusive chat for crypto traders!
Don't forget to subscribe to our official CScalp news channel, use trading signals and get to know our bot.
If you have any questions, just contact our platform's support via Telegram at @CScalp_support_bot. We will respond in a matter of seconds.
You can also visit our Discord channel and subscribe to the CScalp TV YouTube channel.
JOIN OUR CHAT
