
Flag Pattern Trading Strategies for Crypto Traders
Traders are continuously seeking reliable methods to forecast and capitalize on financial market movements. That includes candlestick trading, where flag patterns stand out for their effectiveness and popularity. Recognizing and understanding these patterns can be a game-changer. CScalp explores how to enhance your trading using flag patterns.
Attention! This article is for informational purposes only and does not contain recommendations or calls to action.
The review has been prepared by the CScalp terminal team. You can get CScalp by leaving your e-mail in the form below.
Understanding the Basics of Flag Pattern Trading
Flag patterns are a form of continuation pattern in technical analysis, indicating a pause in the prevailing trend before its resumption.
Characterized by a sharp price movement followed by a consolidating rectangular shape, these patterns resemble a flag on a pole, hence the name. The ‘flagpole’ forms with a significant and rapid price movement, while the ‘flag’ is created through a period of consolidation, moving against the initial trend direction.
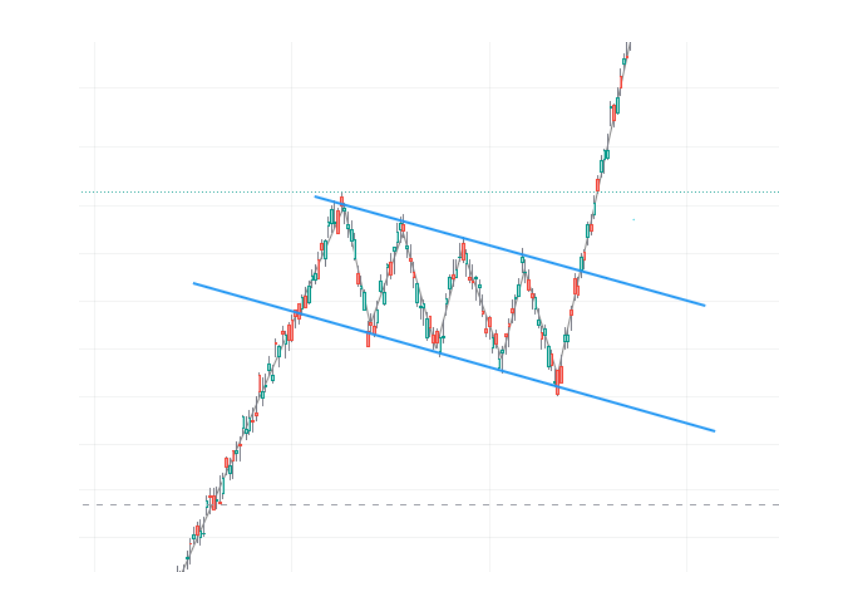
For example, a bullish flag pattern can appear in an uptrend and suggest a continuation of the upward movement. Conversely, the bearish flag forms during a downtrend and signals a potential continuation of the downward trend.
How to Identify Flag Patterns: Practical Tips
Let’s explore the main characteristics of bullish and bearish flag patterns on the candlestick charts to learn how to identify them easily.
How to Identify Bullish Flag Patterns
- Formation of the Flagpole: The inception of a bullish flag pattern is marked by a significant and rapid increase in price. This surge, known as the flagpole, is often fueled by strong buying volume, indicating a robust demand for the asset.
- Consolidation Phase: Following the sharp ascent, the price enters a consolidation phase. It’s important to note that this phase does not erase the gains of the flagpole but rather represents a period where traders are taking profits and new buyers are considering entry.
- Parallel Trendlines: The consolidation phase is typically contained within two downward-sloping, parallel trendlines. This creates a flag-like appearance, hence the name. The volume during this phase usually diminishes, which aligns with the market’s pause.
- Breakout: The culmination of this pattern is the breakout. A resurgence in buying pressure that pushes the price above the upper boundary of the flag confirms the pattern. Ideally, this breakout should be accompanied by an increase in volume, lending credence to the continuation of the uptrend.

How to Identify Bearish Flag Patterns
Bearish flag patterns are the counterpart to bullish flags, signaling potential downward trends in a market.
- Flagpole Development: A bearish flag pattern begins with a sharp price decrease. This decline, forming the flagpole, is indicative of strong selling pressure and a clear shift in market sentiment.
- Consolidation Phase: After the initial drop, the price stabilizes and moves slightly upward or sideways. This creates the ‘flag’ of the pattern. This phase is typically a combination of profit-taking by initial sellers and cautious buying.
- Upward-Sloping Flag: Unlike the bullish flag, the consolidation phase in a bearish flag is contained within two upward-sloping, parallel trendlines. This counterintuitive movement against the dominant downtrend is temporary and typically occurs on low trading volumes.
- Breakdown: The bearish flag pattern is confirmed when the price breaks down below the lower trendline of the flag. A spike in trading volume during the breakdown often accompanies this move, reinforcing the likelihood of a continued downtrend.
Trading Strategies for Flag Patterns
Flag patterns, both bullish and bearish, offer unique opportunities for traders. However, capitalizing on these patterns requires a well-defined strategy. Let’s delve into the specifics of identifying entry and exit points, setting stop-loss orders, and other essential strategies for trading flag patterns effectively.
How to Trade Bullish Flags
- Entry Point: For a bullish flag, the optimal entry point is typically just after the price breaks above the upper trendline of the flag and makes a “confirmation”. The breakout is a signal that the previous uptrend is resuming. To confirm the breakout, traders should also look for an increase in volume.
- Exit Point: The exit point is typically determined based on the initial rise that formed the flagpole. Projecting this distance upward from the breakout point gives a target exit level. However, traders should also monitor the price action for signs of a reversal to exit earlier if necessary.
- Stop-Loss Orders: Place a Stop-Loss order just below the lowest point of the flag or the consolidation area. This minimizes potential losses if the breakout fails.
Watch a video about Bullish Flag trading:
How to Trade Bearish Flags
- Entry Point: In bearish flag trading, enter a position just after the price breaks below the lower trendline of the flag. The increased volume at this point can validate the continuation of the downtrend.
- Exit Point: Similar to the bullish flag, the exit point can be estimated by projecting the length of the flagpole downwards from the point of breakout. Monitoring market trends and price action is crucial to adjust the exit strategy as needed.
- Stop-Loss Orders: Set the Stop-Loss order just above the highest point of the flag to limit losses in case the expected downtrend does not materialize.
To take full advantage of flag pattern trading, try the professional trading platform CScalp by leaving your email in the form above. With the free terminal, you will be able to connect to an exchange and place orders with one click, automatically set Stop-Loss and Take Profit orders, as well as manage your risks.
Additional Trading Strategies
Let’s explore other strategies and tools to help you improve your operations.
- Using Technical Indicators: Incorporating technical indicators like Relative Strength Index (RSI), Moving Averages, or Bollinger Bands can provide additional confirmation of the flag pattern and help in making more informed trading decisions. Learn more about technical indicators in our blog.
- Timing Considerations: The timing of the trade is crucial. Flag patterns typically form over short periods. Extended consolidation periods might weaken the reliability of the pattern.
- Combining Your Knowledge with Fundamental Analysis: While flag patterns are a technical indicator, combining them with fundamental analysis of the asset can offer a more holistic view. This approach is particularly relevant in markets like cryptocurrencies, where news and events can significantly impact prices.
Harnessing the Power of Flag Patterns
Flag pattern trading provides a powerful tool for navigating both bull and bear markets. As we have seen, volume is a key factor in confirming this pattern. By understanding and applying the concepts and strategies discussed, we hope you can enhance your market analysis and decision-making skills. Continuous learning and adaptation to market changes are key to success in flag pattern trading.
CScalp offers a free trading course and a YouTube channel, excellent resources for both novice and experienced traders.
Learn how to interpret other trading patterns from our blog: Wedge Pattern Trading: How to Spot and Capitalize on Market Trends
Join the CScalp Trading Community
Join our official trader's chat. Here you can communicate with other scalpers, find trading soulmates and discuss the market. We also have an exclusive chat for crypto traders!
Don't forget to subscribe to our official CScalp news channel, use trading signals and get to know our bot.
If you have any questions, just contact our platform's support via Telegram at @CScalp_support_bot. We will respond in a matter of seconds.
You can also visit our Discord channel and subscribe to the CScalp TV YouTube channel.
JOIN OUR CHAT