
POPULAR CANDLE PATTERNS FOR TECHNICAL ANALYSIS
We have prepared a catalog of popular trading candlestick patterns. In the catalog, we consider bullish and bearish trend reversal patterns, trend continuation patterns and patterns that can occur during both bullish and bearish reversals.
Attention! This article is for informational purposes only and does not contain recommendations or calls to action.
The review has been prepared by the CScalp terminal team. You can get CScalp by leaving your e-mail in the form below.
What is a candlestick and what are candlestick patterns?
A Japanese candlestick is a visual unit of market price movement. It looks like a small rectangle with thin lines sticking out of its top and bottom. The main part of a candle is called the “body”, and the lines above and below are called “shadows” or “wicks”.
In most trading terminals and analytical platforms, candles are green and red. A green candle is called Bullish. It means that the price has grown since the candle opened. That is, the closing price is higher than the opening price. Bearish candles are the opposite – colored red, they show a price decline compared to the opening price (the close price is lower than the open price).

Japanese Candlestick structure
Sometimes (most often in Forex trading) bullish candles are white or transparent, while bearish candles are black or grey. Many charting tools and platforms, including the CScalp trading terminal, allow you to customize candles and set your own colors.
A candle is a time unit of price development over time. On a 5-minute time frame, each candle represents 5 minutes of price movement. On an hourly TF, each candle is 1 hour, and so on.
In a bullish candle, the lower shadow shows the lowest price over the time period, while the upper one is the maximum value. The lower end of the body is the opening price of the candle, and the upper end is its closing price.
A bearish candle is an exact opposite. The wick also show the minimum and the maximum price. The difference is that the upper side of its body is the opening price, while the lower one is its closing.
That said, it should be noted that the type of candle is only known after it’s closed. It’s not uncommon for candles to shift between bullish and bearish many times while they’re open. This is especially relevant to smaller time frames (1m, 5m, and 15m). On larger time frames though (4H and upwards), it’s usually more clear where the price is headed, and each candle’s type is known well before it’s closed. The length of the candle depends on the amplitude of the price moves. The greater the spread between prices, the longer the body will be. Long candles translate to high volatility, a feature much sought after by scalpers and day traders.
Most often, the word “shadows” is applied to both the lower and the upper line of the candle. Some sources use “shadow” only for the bottom line, and “wick” only for the top line.
What are Candlestick patterns?
Candlestick patterns are recurring formations of several candles in a row. Candlestick analysis assumes that as soon as the candles align in a particula order, you should expect a predictable price change.
Patterns are used in trading cryptocurrencies, stocks, futures and other assets as part of technical analysis. They are particularly popular in day trading, mid-term and swing trading. Candlestick patterns can be divided into three groups:
- Trend reversal patterns. As the name implies, these patterns foreshadow a reverse in the current trend. If one is seen in an uptrend, then the price will be going down, if there’s one in a downtrend – then the price is about to head up.
- Trend continuation patterns. These patterns signify that the current trend is likey going to continue, and that long traders can keep going long, and short traders can keep going short for the time being.
- Other models. Patterns can also appear during markets flats. This group also includes ‘two-sided’ models, wherein the forecast depends on the specific location of the figure or the moment of its appearance.
Note: Candlestick patterns are not a direct signal to enter a trade. They should only be viewed an additional factor in your analysis. Their readings should be compared with the assessment of volumes,technical indicators, the order book, the tape, and other analysis tools.
Bullish Candlestick Patterns
Hammer
The Hammer candlestick pattern is characterized by a small body. The shadow is in line with the trend. The second shadow is smaller than the first one, or isn’t present at all. The pattern is formed at the bottom of a downtrend. The Hammer is often seen in trading and is easily identified due to the simple but noticeable shape of the pattern.
Hammer pattern
Inverted Hammer
The Inverted Hammer pattern is similar to the regular Hammer pattern. The difference is that the wick above the body is longer than the one below it. The top wick is also at least twice as long as the body. This pattern can also be found at the bottom on a downtrend and regarded as a signal for trend reversal.
The Inverted hammer pattern
The upper wick indicates that the price has stopped moving at the bottom, near the candle’s opening point. Therefore, the Inverted Hammer can indicate that buyers are taking control of the situation.
Three white soldiers
The Three White Soldiers pattern consists of three green candles in a row. Each new candle opens at the body level of the previous one and closes above it.
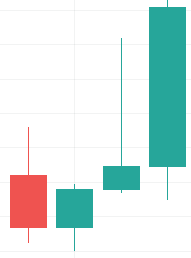
Three white soldiers
The appearance of the pattern indicates that buyers are pushing the price up. The size of the candles and the length of the wicks point to the probability of market consolidation or a pullback.

Morning Star
The Morning Star candlestick pattern consists of at least three candles. The body of the middle candle should be notably shorter than those of the neighboring candles.
Morning star pattern
Also, the middle candle may open and close with a small gap. The color of the candle does not matter. The appearance of the “Morning Star” pattern on the chart may signal an upcoming increase in the price.
Bullish harami
A Piercing Pattern signals a reversal of a bearish trend towards a bullish one. Formed after a local minimum, it starts with a long bullish candle, the lower edge of which is placed well below the low of the last bearish candle (left).
Bullish harami pattern
Piercing Pattern
A Piercing Pattern signals a reversal of a bearish trend towards a bullish one. Formed after a local minimum, it starts with a long bullish candle, the lower edge of which is placed well below the low of the last bearish candle (left).
Bullish Engulfing pattern
The next, second green candle opens above the high of the first green candle, sometimes with a small gap.
Bullish engulfing
The Bullish Engulfing pattern can predict a trend reversal from falling to rising. Visually, a bullish engulfing is a long green candle, indicating a strong upwards momentum. It’s usually preceded by 3 or 4 red candles, however, some methods consider even one red candle before the green one.
Inverted hammer pattern
In an ideal bullish engulfing, the height of the green candle is greater than or approximately equal to the combined height of the previous three candles (red). Usually, the pattern is formed at local lows within the timeframe. It signifies the end of sales and the start of a buying phase.
Bearish Candlestick Patterns
Shooting star
The Shooting Star pattern has a candle with a high shadow on top and a short shadow on the bottom. Sometimes there is no bottom wick at all. The pattern is characterized by a short candle body.
The Shooting Star pattern
This pattern resembles the Inverted Hammer. Unlike the Inverted Hammer, it appears at the end of an uptrend. A Shooting Start hints that the current market momentum has peaked, and sellers have taken the lead.
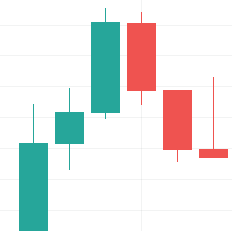
Three black crows
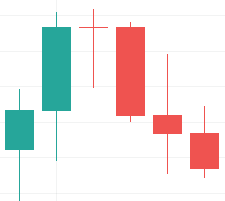
The Three Black Crows pattern is a mirror image of the Three White Soldiers pattern. It’s made up of three bearish candles, each opened around the level of the preceding candle, and closed below it.
Pattern Three black crows
The appearance of the Three Black Crows may signal that the sellers are pushing the price down. The length of the shadows will help assess the likelihood of consolidation. The longer the shadows and candles, the higher the selling activity.
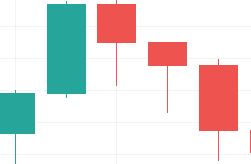
Dark Cloud Cover
The Dark Cloud Cover is the bearish version of the Piercing Patter. It consists of a red candlestick with an open higher than the previous green candlestick’s close. The candle closes below the middle of the previous candle. Often, this pattern is accompanied by large volumes, suggesting that the momentum is turning to sell.
The Dark Cloud Cover Pattern
Hanging Man
The Hanging Man pattern is perceived as a bearish analog of the Hammer. As a rule, the pattern is usually seen at the end of an uptrend. The Hanging Man pattern is a red candlestick with a small body. The lower wick is long relative to that of the neighboring candles. The upper shadow is notably smaller or non-existent. The longer the lower shadow, the more sales have been taking place. When this occurs, the bulls can fight off the fall and regain control. Most often, the Hanging Man indicates a trend reversal.
The Hanging Man pattern
Bearish engulfing
The Bearish Engulfing pattern is the exact opposite of the Bullish Engulfing. It looks like a long red candle following a series of short green candles. This pattern means that a small series of buys was interrupted by one powerful sales impulse. This pattern may lead to a trend change towards falling.
Bearish Engulfing pattern
An important point in the Bearish Engulfing is the comparative length of the candles. The red candle should be equal to, or longer than, the previous three or four selling candles combined.
Bearish Harami
The Bearish Harami pattern is a tall green candle followed by a notably smaller red one. The pattern is usually found at the end of an uptrend. Harami can signify that buyers have lost control of the situation, and the trend is about to head downwards.
Bearish harami pattern
Gravestone Doji
Dojis are elements of a candlestick chart that are not like standard candlesticks. The doji’s body is usually almost invisible. At the same time, it has rather long shadows – often longer than those of the neighboring candles.
Gravestone Doji Pattern
The Gravestone Doji pattern doesn’t have a body – it opens and closes at roughly the same price. Ideally, it’s located between two candles about the same size. The upper wick is long, the lower wick is very short or nearly absent. This pattern indicates a possible trend reversal.
Trend Continuation Candlestick Patterns
Rising Three Methods
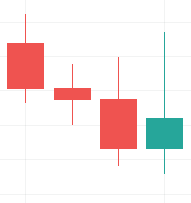
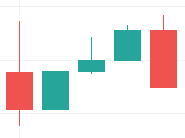
The Rising Three Methods pattern is formed during an uptrend. It looks like three red candles, each smaller (and possibly slightly lower) than the previous one. The most important condition is that the red candles must be both followed and preceded by long green ones.
Rising Three Methods Pattern
This pattern signals a possible trend continuation. The signal can be confirmed by a subsequent green candle with a long body.
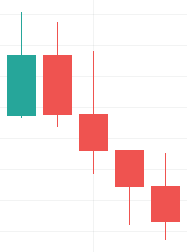
Falling Three Methods
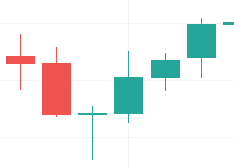
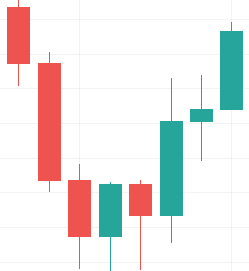
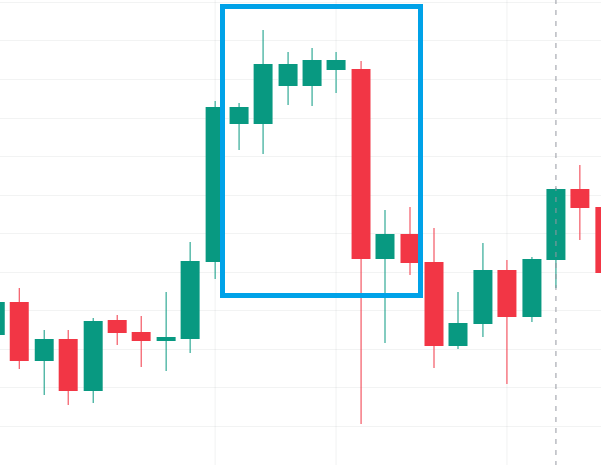
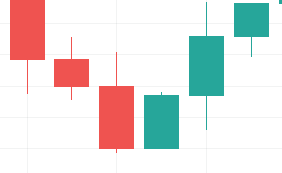
The Falling Three Methods mirrors the Rising Three Methods pattern; it’s mostly noticeable in a downtrend. It looks like three small green candles in a row, followed by a long red candle. Such a pattern is interpreted as an unsuccessful attempt by buyers to push the price up and signifies a reversal of the downtrend.
The Falling Three Methods pattern
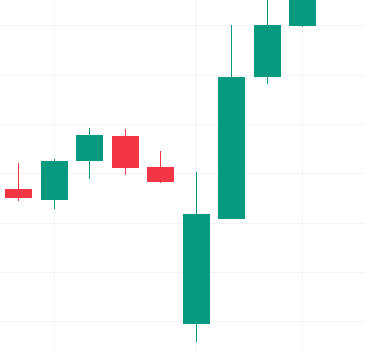
Three Line Strike
The Three Line Strike pattern can form in both bull and bear markets. It looks like a powerful, impulse candle disrupting the trend. It must be preceded by at least three candles of the trend’s color.
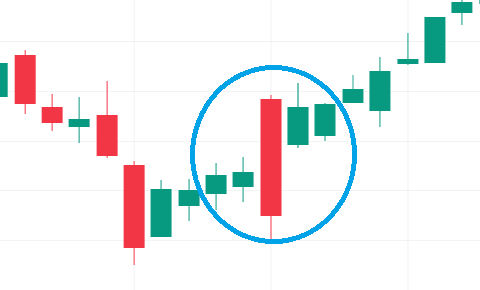
Three-Line Strike
The key point is the length of the candles. The candle that forms the “Triple Strike” should overlap in length with the three previous candles. That is, the ‘strike’ candle itself is longer than the three preceding candlesticks combined.
The Three Line Strike is usually formed in the middle of a trend. If the patterns appear amid an overall uptrend, then the trend is likely to continue. If the overall trend is down and the TR appears on a green candle, then the subsequent trend is bearish.
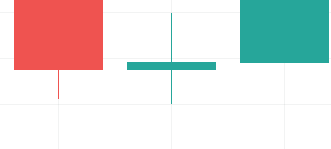
Mat Hold
The Mat Hold is a complex, rare pattern that signals the continuation of the current trend. It normally appears after small gaps. The pattern can be formed both on the bullish and bearish trends.
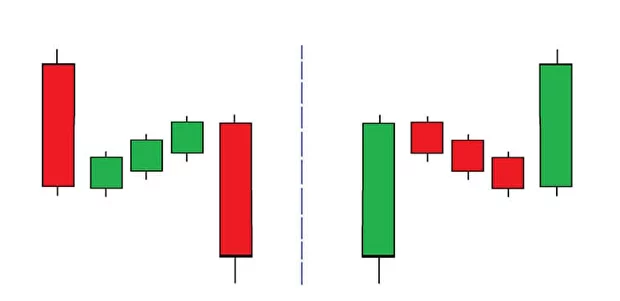
The Mat Hold pattern (left is the bearish version, right is bullish)
The Mat Hold can be found roughly middle of a clear trend. The pattern consists of three candles of the same color, opening after a gap against the main trend. If the trend is up, then after the gap, the first Hold candle will be medium/long red. The second candle is usually much longer than the first, the third is shorter/equal to the second. If the trend is down, the candles are green. The next candle, opening right after the pattern, goes in line with the main trend.
If the pattern is bullish, that is, there are three bearish candles in it, then the fourth candle will be a strong buying impulse and will correspond to the main trend. If the pattern is bearish (three green candles), then the final element will be a long red candle, also in line with the main trend.
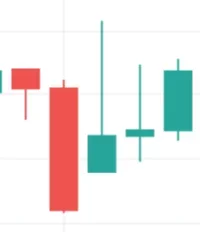
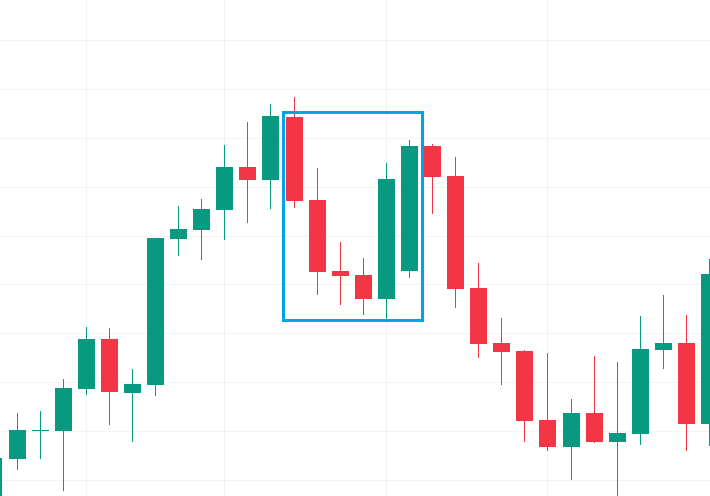
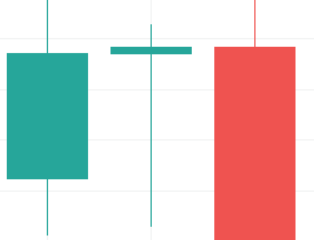
Tasuki Gap
The Tasuki Gap pattern also forms after gaps. In fact, this is a visual display of the correction that occurred on the wave that formed the gap in the first place. A Tasuki Gap confirms the currently formed trend.
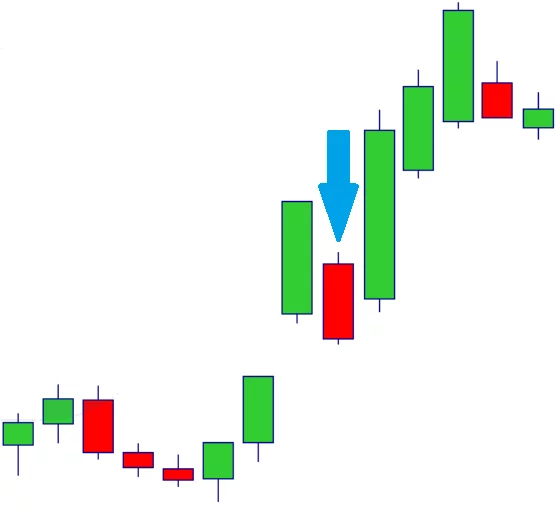
Tasuki Gap Pattern
If the main trend is up and the pattern comes as a red candle, then the subsequent price movement will also be up. If the trend is down and the gap is seen on a green candle, then the subsequent movement of the will be down. To correctly interpret the Tasuki Gap, you need to consider its length. Most often, this candle will be slightly shorter than the first one that opened after the gap. However, Tasuki doesn’t cover the gap completely, overlapping it only partly.
Other candlestick patterns
Long-legged doji and dragonfly doji
The Long-legged Doji pattern appears during a still market, when traders cannot push the price in either direction. The pattern closes around the middel of the adjacent green candle. Wicks appear on both sides. Such a pattern does not indicate a trend change, nor does it confirm its continuation. The appearance of the Long Legged Doji means that participants are waiting out an unclear market situation.
Long-legged doji pattern
Related to it is the Dragonfly Doji pattern. The close of this candlestick is near the local high. The upper shadow is short, and the body is often nested around the top levels of the neighboring candles. The bottom wick is disproportionately long. The Dragonfly Doji can be either bullish or bearish, depending on the market situation.
Dragonfly Doji Pattern
It is assumed that the open and close of the doji candle should be at the same level.
Doji Rickshaw
Doji Rickshaw is another model belonging to the Doji group. A Rickshaw is a powerful reversal signal that can appear in both rising and falling markets. Proportions are of key importance in the Rickshaw. The wicks must be near symmetrical.
Doji Rickshaw Pattern
The Rickshaw displays an almost perfect market equilibrium, wherein the highs are equally removed from the lows. Traders should keep in mind that such situations are extremely uncertain and require caution.
Four price doji
Four Price Doji cannot really be called a full-fledged pattern. The figure looks like a small dash on the chart. A Four-price Doji is a rare occasion in trading. Most often, the figure appears on illiquid assets, or on those with extremely low trading volumes.
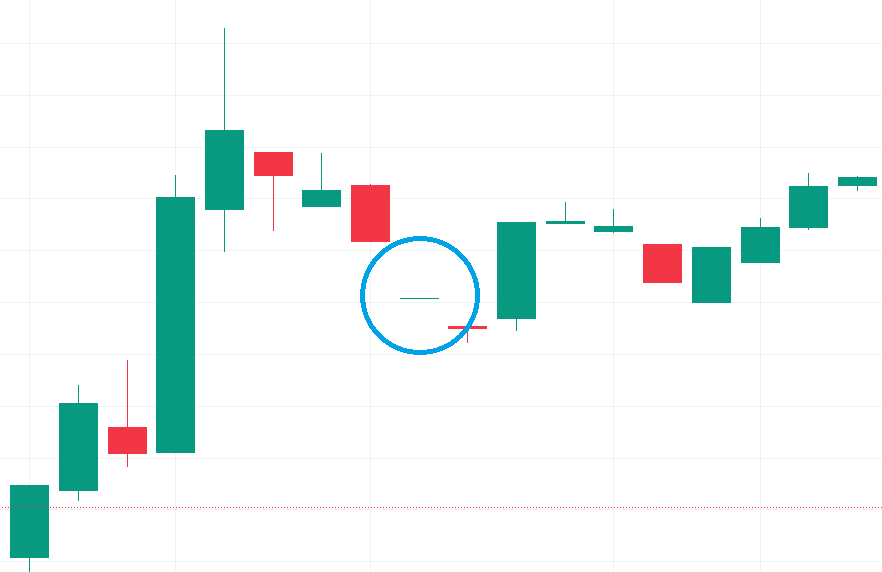
Four Price Doji Pattern
Unlike other dojis, the DFC pattern provides little information to the trader and can only symbolize market sluggishness. You can usually see four price dojis on charts with a lot of gaps. Such a picture doesn’t point to a rise or fall, but rather a lack of trading activity.
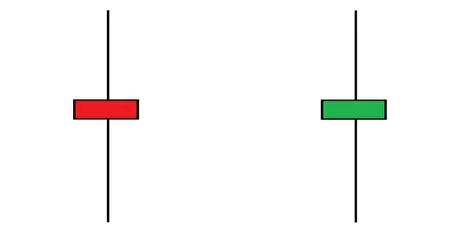
Tweezers
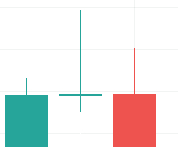
The Tweezers pattern is two candles, with long wicks and roughly equal bodies. The lower sides of the bodies must coincide. At the same time, the candles are of different colors. If the first candlestick is bearish, its lower edge (closing) is at the same level as the edge of the green candle (opening). And vice versa: if the left candle is a bullish one, then its opening is at the same level as the closing of the bearish right candle.
Tweezers
The first candle of the Tweezers coincides with the current trend, while the second one opposes it. If the trend is up then, the first candle is bullish, if it’s down – bearish. And vice versa. As a rule, the Tweezer candlestick pattern is formed after a long trend and may portend its reversal. In technical analysis, Tweezers is not tied to a bull or bear market – the assessment of the model depends on the location and color of the candles making up the pattern.
Abandoned baby
The Abandoned Baby pattern is a doji candle formed after strong momentum and a long trend candle. The ‘Baby’ is usually a small gap away from the main sequence of candles, hence its name. This pattern shows that the strength of sellers/buyers has ended in the previous long candle and a reversal is afoot.
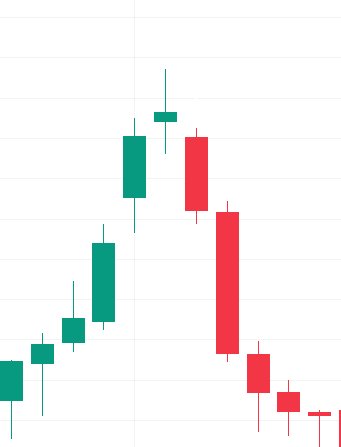
Abandoned baby pattern
If the Abandoned Baby appears after a long green candle, you can expect the price to drop. And vice versa – if the pattern is formed after a red candle, then that points to upcoming growth.
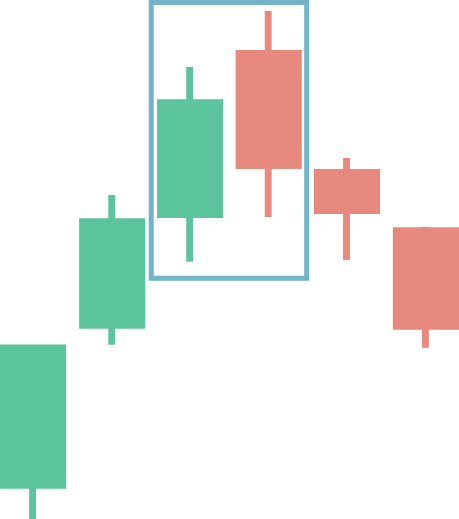
Maruboz
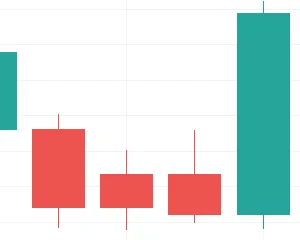
The Marubozu candlestick pattern consists of candles without shadows, usually with relatively long bodies. The absence of a shadow indicates that all trades in the given range have been executed, including the maximum prices in the time period. That is, all buy and sale orders were covered.
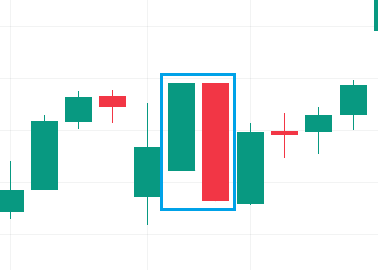
Marubozu candles, highlighted in blue
A bullish marubozu may indicate that the potential of buyers has dried up and a price reversal is possible. The appearance of a bearish marubozu, on the contrary, indicates that all sales have been depleted and subsequent growth is possible.
Join the CScalp Trading Community
Join our official trader's chat. Here you can communicate with other scalpers, find trading soulmates and discuss the market. We also have an exclusive chat for crypto traders!
Don't forget to subscribe to our official CScalp news channel, use trading signals and get to know our bot.
If you have any questions, just contact our platform's support via Telegram at @CScalp_support_bot. We will respond in a matter of seconds.
You can also visit our Discord channel and subscribe to the CScalp TV YouTube channel.
JOIN OUR CHAT