
Mastering the Head and Shoulders Trading Pattern
The Head and Shoulders pattern, a classic in the technical analysis of candlestick trading, is instrumental in predicting trend reversals, transitioning from bullish to bearish trajectories. CScalp explains how to identify this pattern and reveals strategies to use while trading this pattern.
Attention! This article is for informational purposes only and does not contain recommendations or calls to action.
The review has been prepared by the CScalp terminal team. You can get CScalp by leaving your e-mail in the form below.
What Is Head and Shoulders Pattern in Trading?
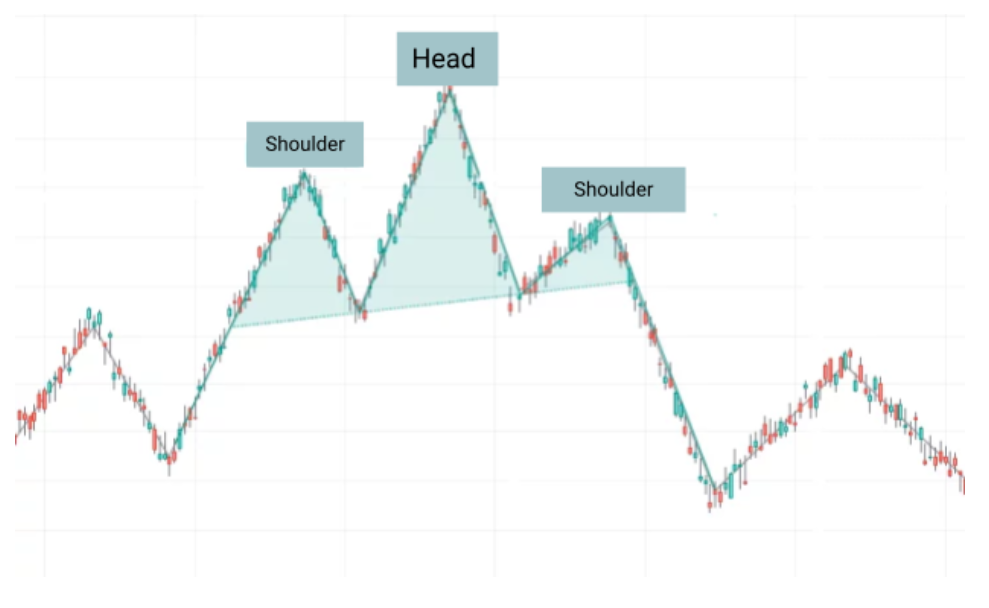
The Head and Shoulders pattern serves as an indicator for predicting trend reversals in the markets. Characterized by three peaks, with the highest (the head) situated between two lower ones (the shoulders), this pattern symbolizes a transition from a bullish to a bearish trend.
The significance of the Head and Shoulders pattern in market analysis lies in its ability to offer traders insights into potential selling opportunities, marking the exhaustion of a prevailing trend.
Components of the Head and Shoulders Trading Pattern
Let’s examine each of the components that make up this pattern and explore their meanings.
Left Shoulder Formation
The formation of the left shoulder marks the beginning of the Head and Shoulders pattern. It emerges following a bullish trend, characterized by a peak that subsequently declines to a support level, known as the “neckline”. This shoulder reflects the initial signs of market exhaustion and serves as a precursor to the head formation.
The Head: Identifying the Peak of the Pattern
At the core of the Head and Shoulders pattern is the head, a peak that surpasses the left shoulder’s height. This is where the market reaches its zenith before succumbing to selling pressures, leading to a decline back to the neckline. The head represents the climax of bullish sentiment, often accompanied by increased trading volume.
Right Shoulder Formation
Mirroring the left, the right shoulder forms as the market makes a less significant rise after the head. Unable to sustain the bullish momentum, this shoulder indicates a weakening trend and a growing inclination towards a bearish reversal. It usually doesn’t reach the height of the head, signifying diminished buying interest.
Neckline in Pattern Recognition
The neckline acts as a pivotal support level in the Head and Shoulders pattern. It is formed by connecting the lowest points of the two troughs from the left shoulder and head. A decisive break below this line confirms the pattern’s completion and signals a potential bearish reversal, guiding traders in their decision-making process.
Inverted Head and Shoulders Trading Pattern
The Inverted Head and Shoulders trading pattern, in contrast to the traditional Head and Shoulders pattern, is a bullish reversal indicator typically forming at the end of a downtrend. Key differences include:
- Structure: The traditional pattern features three peaks with a higher middle peak (head), whereas the Inverted pattern consists of three troughs with the deepest being the middle trough (head).
- Market Sentiment: While the traditional pattern signals a bearish reversal at the end of an uptrend, the Inverted pattern indicates a bullish reversal following a downtrend.
- Neckline Orientation: In the traditional pattern, the neckline often slopes downwards, suggesting a bearish outlook. Conversely, in the Inverted pattern, the neckline more commonly slopes upwards, indicating bullish potential.
Head and Shoulders Pattern Trading Strategies
Trading with the Head and Shoulders pattern, whether traditional or inverted, involves a blend of identifying entry and exit points, risk management techniques, volume analysis, and advanced trading strategies. Here’s an integrated approach to effectively utilize this pattern in trading:
Entry and Exit Points: Timing Your Trades
- Traditional Pattern: In the classic Head and Shoulders pattern, traders typically enter a short position once the price breaks below the neckline. The height of the pattern, measured from the top of the head to the neckline, can suggest a potential target for exit.
- Inverted Pattern: For the Inverted Head and Shoulders pattern, the strategy involves entering a long position after the price breaks above the neckline. Again, the height of the pattern helps in setting a probable target for exiting the trade.

Risk Management and Stop Order Techniques
For the traditional pattern, placing stop orders just above the pattern’s peak helps in mitigating potential losses. In the inverted pattern, stop orders are ideally set below the lowest point of the head. These stop orders ensure quick exit if the market moves contrary to the expected direction.
Volume Analysis for Confirming Pattern Strength
An increase in trading volume at the formation of the head and a decrease as the right shoulder forms are typical in the traditional Head and Shoulders pattern. A significant increase in volume during the neckline breakout further confirms the pattern’s strength. In the Inverted pattern, a similar increase in volume during the neckline breakout is a crucial confirmation signal.
Contextual Analysis
It’s important to consider the broader market context when analyzing the pattern. Market sentiment, economic indicators, and major news events can significantly impact the pattern’s formation and effectiveness.
Combining Head and Shoulders Pattern with Other Indicators
Using other technical indicators like moving averages, RSI, and MACD alongside the Head and Shoulders pattern enhances its reliability. For instance, a bearish divergence in RSI during the right shoulder formation in the traditional pattern can reinforce a bearish outlook.
Time Frame Analysis
Examining the pattern across various timeframes offers a more holistic view. Patterns identified on longer timeframes like daily or weekly charts generally have stronger predictive power compared to those on shorter timeframes.
Target Projection Accuracy
For precise profit targets, measure the distance from the top of the head to the neckline and project this distance from the point of the neckline breakout.
Fibonacci Levels
Incorporating Fibonacci retracement levels can refine the accuracy of entry and exit points. These levels can provide additional support or resistance areas, offering nuanced insights into potential price movements post-pattern formation.
Mastering the Head and Shoulders Pattern
The Head and Shoulders trading pattern, both in its traditional and inverted forms, offers a comprehensive framework for traders seeking to decipher market trends and harness profitable opportunities. By integrating these patterns into your trading strategies, along with a robust understanding of market contexts, risk management, volume analysis, and the use of complementary indicators, you can enhance your ability to make informed decisions and execute successful trades. Don’t forget to use CScalp to open your positions with one click in the cryptocurrency market.
Related article: M and W Trading Patterns: How to Use Them
Join the CScalp Trading Community
Join our official trader's chat. Here you can communicate with other scalpers, find trading soulmates and discuss the market. We also have an exclusive chat for crypto traders!
Don't forget to subscribe to our official CScalp news channel, use trading signals and get to know our bot.
If you have any questions, just contact our platform's support via Telegram at @CScalp_support_bot. We will respond in a matter of seconds.
You can also visit our Discord channel and subscribe to the CScalp TV YouTube channel.
JOIN OUR CHAT