
Fibonacci Trading Strategy: A Powerful Approach for Crypto Trading
Fibonacci trading strategy is widely used to identify potential support and resistance levels on the chart. It is one of the key crypto trading strategies, where specific levels indicate possible reversal points in price movements. By understanding and implementing this technique, you can make informed decisions and predict future price directions. CScalp explores the concept of Fibonacci retracement, its benefits, practical steps for implementation, and advanced applications.
Attention! This article is for informational purposes only and does not contain recommendations or calls to action.
The review has been prepared by the CScalp terminal team. You can get CScalp by leaving your e-mail in the form below.

Understanding Fibonacci Retracement
The concept of Fibonacci retracement is based on the idea that certain ratios, derived from the Fibonacci sequence, can naturally occur in financial markets. This strategy involves using Fibonacci retracement levels to identify potential areas of support and resistance in the price movement of an asset.
Related article: Master Your Trades with Backtesting Trading Strategies
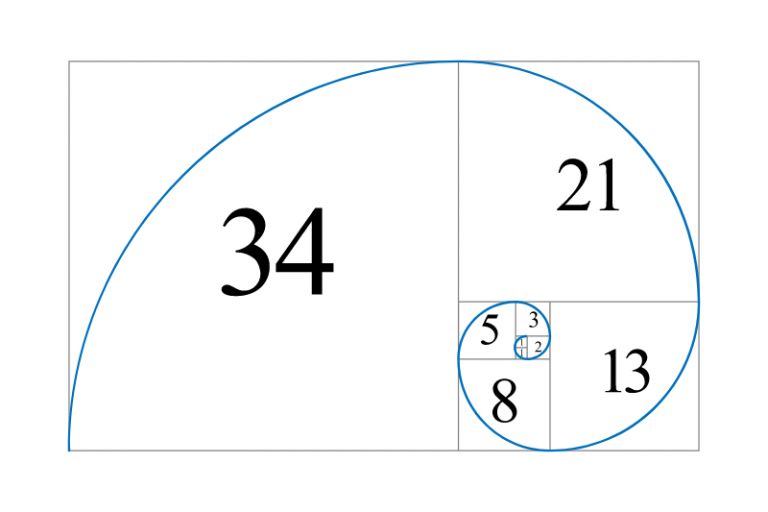
The Concept of Fibonacci Retracement
Fibonacci trading strategy is based on the Fibonacci sequence, a mathematical sequence where each number is the sum of the two previous numbers (e.g., 0, 1, 1, 2, 3, 5, 8, 13, 21, etc.). The key ratios derived from this sequence, such as 38.2%, 50%, and 61.8%, are used as the primary Fibonacci retracement levels.


How Fibonacci Retracement Works in Trading
In trading, Fibonacci retracement levels are plotted on a price chart to identify potential support and resistance levels. The idea is to look for these levels during market trends, especially when the price is experiencing a pullback or a correction. The retracement levels act as guides, indicating where the price might reverse and continue in the direction of the overall trend.
Benefits of Using Fibonacci Retracement in Crypto Trading
Fibonacci retracement offers several benefits when applied to crypto trading. Firstly, it helps identify key levels where the price is likely to pause or reverse, allowing for potential entry and exit points. Secondly, it provides a visual representation of the market structure, enabling you to visualize the potential strength of support and resistance zones. Finally, Fibonacci retracement can assist in setting realistic profit targets and managing risk by identifying price levels where the trend may potentially resume or change direction.
Implementing the Fibonacci Trading Strategy
Implementing the Fibonacci trading strategy involves understanding key principles, identifying support and resistance levels using Fibonacci retracement, and utilizing Fibonacci extensions for target levels. Let’s explore each of these aspects in detail.
Key Principles of the Fibonacci Trading Strategy
- Begin with understanding the Fibonacci sequence, which is a mathematical sequence where each number is the sum of the two preceding numbers.
- Apply the Fibonacci ratios, especially the most commonly used levels like 38.2%, 50%, and 61.8%, to identify potential turning points in price movements.
- Remember that the Fibonacci retracement works best in trending markets, allowing you to buy on retracements in an uptrend or sell on retracements in a downtrend.
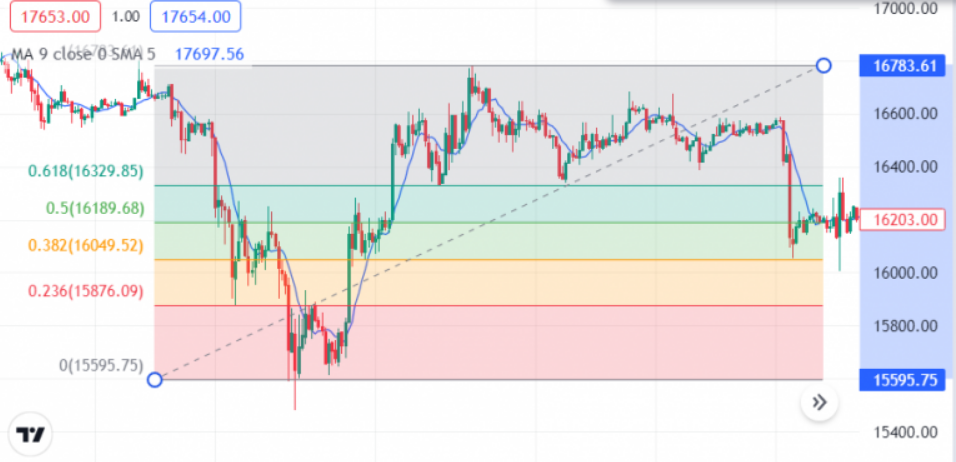
Identifying Support and Resistance Levels with Fibonacci Retracement
One of the primary applications of the Fibonacci trading strategy is to identify support and resistance levels in the market. Use the Fibonacci retracement tool to plot horizontal lines at key Fibonacci levels, such as 38.2%, 50%, and 61.8%, to pinpoint potential reversal zones.
Support levels are where buying pressure is anticipated, while resistance levels indicate potential selling pressure. By analyzing price reactions at these Fibonacci levels, traders can make informed decisions regarding entry, exit, and Stop-Loss levels.
Using Fibonacci Extensions for Target Levels
While Fibonacci retracement helps identify potential reversals, Fibonacci extensions come into play for identifying target levels or profit-taking zones. Plot Fibonacci extension levels beyond 100% to project potential price targets based on the prevailing trend.
By combining Fibonacci retracement with extensions, you can establish a comprehensive trading plan that includes both potential entry and exit levels based on Fibonacci principles.
Implementing the Fibonacci trading strategy requires a thorough understanding of these key principles, the ability to identify support and resistance levels, and the utilization of Fibonacci extensions for target levels. By integrating these techniques with risk management strategies and leveraging platforms like CScalp, you can enhance your precision and decision-making in the crypto market.
Practical Steps for Drawing Fibonacci Retracement in an Uptrend
Finding the Correct Starting Point
The first step in drawing Fibonacci retracement in an uptrend is to identify the correct starting point. Look for a significant swing low on the price chart that marks the beginning of the uptrend. It should be a clear and distinct point that shows a shift from a downtrend to an uptrend. This starting point will serve as the reference for drawing the retracement levels.
Drawing the Retracement Levels
Once you have identified the starting point, it’s time to draw the retracement levels. Using a charting platform or software like TradingView, locate the Fibonacci retracement tool and select the starting point. Then, extend the tool to the highest point of the uptrend. The tool will automatically plot several horizontal lines representing the potential retracement levels.
The most commonly used retracement levels are 38.2%, 50%, and 61.8%. These levels are derived from specific ratios in the Fibonacci sequence and are considered significant areas of support where prices might bounce back.
Analyzing Price Reactions at Fibonacci Levels
Once the retracement levels are drawn, it’s essential to analyze how the price reacts at these levels. Keep an eye on the price action as it approaches each retracement level. Look for signs of support or resistance, such as price consolidating, reversing, or forming candlestick patterns. These reactions can provide valuable insights into whether the Fibonacci retracement levels are influencing the price movement.
Remember that Fibonacci retracement is a tool and not an exact science. It works best when combined with other technical indicators and analyzed in the context of the overall market conditions and trends. Regularly monitor and adjust the Fibonacci levels as the price evolves to ensure their continued accuracy.
By following these practical steps for drawing Fibonacci retracement in an uptrend, you can effectively identify potential points of support and develop a well-informed trading strategy.
Setting up Fibonacci Retracement on TradingView
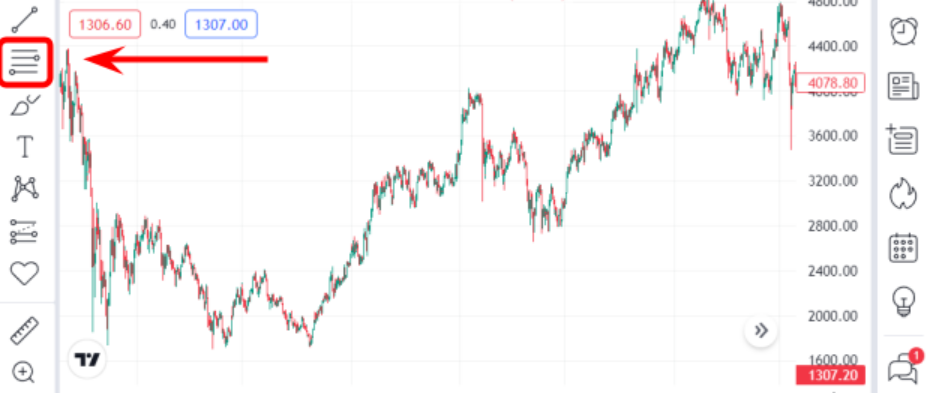
Accessing the Fibonacci Retracement Tool on TradingView
When using TradingView for Fibonacci analysis, accessing the Fibonacci retracement tool is simple and intuitive. Follow these steps:
- Open TradingView and select the desired trading chart.
- Locate the toolbar at the top of the screen.
- Click on the ‘Drawing Tools’ icon, represented by a pencil or a horizontal line.
- A drop-down menu will appear. Scroll down and select ‘Fibonacci Retracement’.
Customizing Fibonacci Levels and Colors
TradingView allows you to customize Fibonacci levels and colors to suit your preferences. Here’s how:
- After selecting the Fibonacci retracement tool, click on a specific Fibonacci level line.
- A menu will appear.
- Adjust the values of the selected level, such as the percentage or color, according to your preferences.
- Repeat this process for other Fibonacci levels as desired.
Tips and Tricks for Optimizing Fibonacci Analysis on TradingView
To make the most of Fibonacci analysis on TradingView, consider the following tips and tricks:
- Use multiple timeframes: Apply Fibonacci retracement on different timeframe charts to identify key levels from different perspectives.
- Combine with other technical indicators: Incorporate other tools like trend lines, moving averages, or oscillators to validate Fibonacci retracement levels.
- Stay flexible: Adjust Fibonacci levels as the market evolves, taking into account new price movements and potential support or resistance areas.
- Practice and refine: Experiment with Fibonacci retracement on historical price data to build familiarity and improve accuracy in future analysis.
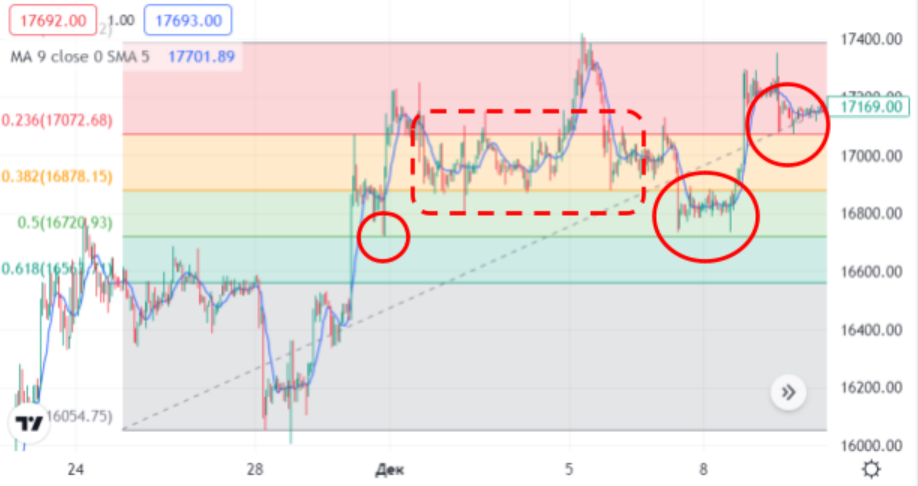
Where to Start: Candle’s Body or Wick?
Many traders wonder whether to build Fibonacci levels from the body or the end of the candle’s wick.
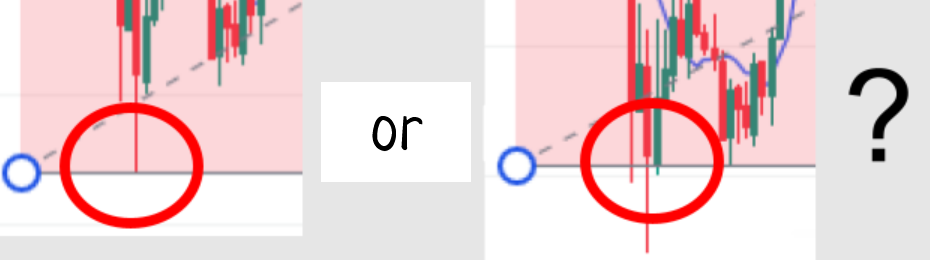
There is no “correct” answer. It’s worth trying both approaches. More often than not, levels are built from the edge of the wick. However, it’s important to understand that the edge of the wick might be the result of a spike at the level. Frequently, the Fibonacci level grid converges if the ends of the wicks (at least one) are excluded.
For example, in the screenshot above, it’s visible that the Fibonacci level grid visually converges if the upper wick of the local maximum is excluded.
Enhancing Your Fibonacci Trading Strategy
When it comes to maximizing the effectiveness of your Fibonacci trading strategy, there are a few key areas to focus on. By combining Fibonacci retracement with other technical indicators, you can gain deeper insights into market dynamics and make more informed trading decisions.
Combining Fibonacci Retracement with Other Technical Indicators
One way to enhance your Fibonacci strategy is to use it in conjunction with other technical indicators. By combining Fibonacci retracement with indicators such as moving averages, oscillators, or trend lines, you can confirm potential entry and exit points. This convergence of signals provides a higher level of confidence in your trading strategy.
Understanding Market Trends and Patterns for Better Decision-Making
Develop a solid understanding of market trends and patterns. By analyzing price action, chart patterns, and trend formations, you can align your Fibonacci retracement levels with key support and resistance areas. This helps you identify high-probability trade setups and improves the accuracy of your trading decisions.
Using CScalp Free Trading Platform for Implementing Fibonacci Strategy
To make the most of your Fibonacci trading strategy, consider utilizing the CScalp free trading platform. This powerful platform offers a range of tools and features specifically designed for active trading with the order book and technical analysis. By combining TradingView and CScalp, you can easily draw Fibonacci levels, customize colors, and adjust parameters to suit your trading style. By leveraging the platform’s real-time data and advanced charting capabilities, you can efficiently execute and monitor your Fibonacci trading strategy.
Remember, it is crucial to continuously adapt and refine your strategy based on changing market conditions. Stay tuned, and don’t forget to join the CScalp community on Discord for more insights.
Next Steps in Fibonacci Trading Strategy
Fibonacci retracement is a powerful tool for identifying support and resistance levels in crypto trading.
Now that you have a solid understanding of Fibonacci retracement and its practical application, it’s time to take the next steps to maximize your success. Here are some key considerations:
- Evaluate and fine-tune your trading plan: Take a step back and review your trading plan. Ensure that your Fibonacci strategy aligns with your overall goals and risk tolerance. Make any necessary adjustments to optimize your trading approach.
- Continuously monitor market trends: Stay updated on market trends and patterns. Keep an eye on the broader market conditions and adjust your Fibonacci levels accordingly. Stay flexible and adapt to changing market dynamics.
- Consider incorporating other technical indicators: While Fibonacci retracement is a robust tool on its own, you can further enhance your analysis by combining it with other technical indicators. Experiment with different indicators and find the combination that works best for you.
- Utilize the CScalp free trading platform: Take advantage of the CScalp free trading platform to implement your Fibonacci strategy effectively. It offers advanced charting features and real-time market data, empowering you to make informed and fast trading decisions.
- Practice effective risk management: Remember that risk management is essential in trading. Set proper Stop-Loss levels and target profits based on your Fibonacci analysis. Be disciplined and stick to your predetermined plan.
By taking the next steps, you can further refine your Fibonacci trading strategy to increase your chances of success in the crypto market. Remember to stay patient, disciplined, and consistent in your approach.
Related article: Master the MACD Trading Strategy for Success in the Crypto Market
Join the CScalp Trading Community
Join our official trader's chat. Here you can communicate with other scalpers, find trading soulmates and discuss the market. We also have an exclusive chat for crypto traders!
Don't forget to subscribe to our official CScalp news channel, use trading signals and get to know our bot.
If you have any questions, just contact our platform's support via Telegram at @CScalp_support_bot. We will respond in a matter of seconds.
You can also visit our Discord channel and subscribe to the CScalp TV YouTube channel.
JOIN OUR CHAT