
Master the MACD Trading Strategy for Cryptocurrency Success
The MACD trading strategy is a crucial asset you could use to discover potential trading opportunities. In this article, we will explore the basics of MACD, the best settings for different time frames, using MACD in combination with other indicators, and advanced techniques such as divergence analysis and convergence divergence. We will also provide tips and highlights to enhance your crypto trading strategies using the CScalp free trading platform.
Attention! This article is for informational purposes only and does not contain recommendations or calls to action.
The review has been prepared by the CScalp terminal team. You can get CScalp by leaving your e-mail in the form below.


What Is MACD?
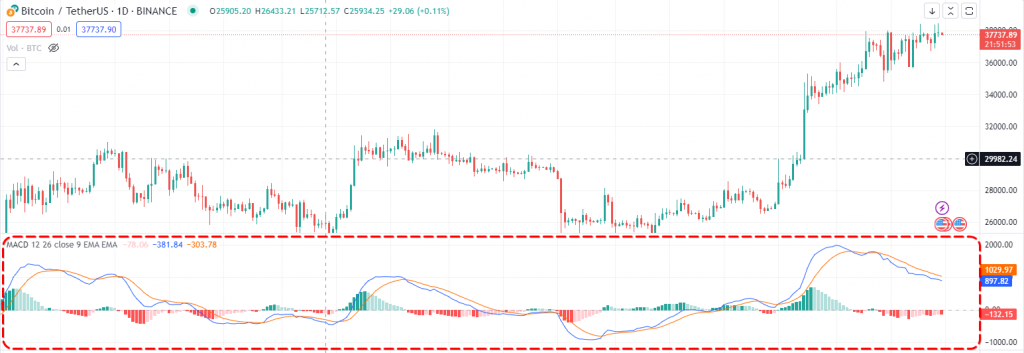
The MACD (Moving Average Convergence Divergence) is a popular technical analysis tool used to identify potential trading opportunities. It is primarily used as a trend-following and momentum indicator, helping you determine entry and exit points in the market.
The MACD consists of several lines and components calculated using exponential moving averages (EMA). The main line of the MACD is calculated by subtracting the 26-period EMA from the 12-period EMA. This main line is commonly known as the MACD line. Additionally, a signal line is calculated, which is a 9-period EMA of the MACD line. The difference between the MACD line and the signal line is represented as a histogram on the chart.
Understanding MACD provides insights into the strength and direction of price trends. By analyzing the relationship between the MACD line and the signal line, you can identify potential bullish or bearish market conditions.
The Basics of MACD Trading Strategy
The MACD trading strategy is built upon the Moving Average Convergence Divergence (MACD) indicator, which helps gauge trends and momentum in the market.
- MACD Calculation: The MACD is derived by subtracting the 26-period Exponential Moving Average (EMA) from the 12-period EMA. This calculation produces the main MACD line.
- Signal Line: To further interpret the MACD, a 9-period EMA known as the signal line is plotted on top of the MACD. The crossover points of the MACD and signal line provide potential buy or sell signals.
Now, let’s delve into the key components and concepts of the MACD trading strategy:
Trend Identification
One important aspect of the MACD trading strategy is to identify the prevailing trend in the market. If the MACD line is above the signal line, it indicates a bullish trend, suggesting potential buy opportunities. Conversely, if the MACD line is below the signal line, it signifies a bearish trend, indicating potential sell opportunities.
Entry and Exit Points
Traders often rely on the crossover of the MACD line and the signal line to determine entry and exit points. When the MACD line crosses above the signal line, it generates a bullish signal to enter a long position. Conversely, when the MACD line crosses below the signal line, it generates a bearish signal to exit a long position or enter a short position.
Confirming Market Conditions
In addition to the MACD and signal line crossovers, traders can look for confirmation from other indicators or market conditions. Combining the MACD with indicators like the Relative Strength Index (RSI) or Moving Averages can enhance the reliability of signals and provide a more comprehensive view of market conditions.
Read our article: Effective RSI Trading Strategy for Crypto Trading
Consideration of Time Frames
The MACD trading strategy can be applied across different time frames, from short-term to long-term trades. You should adjust the settings and parameters of the MACD based on the specific time frame you are trading to ensure accurate signals.
Choosing the Best MACD Settings for 5 Minutes Chart
When applying MACD to a 5-minute chart, it’s crucial to find the optimal settings that can provide accurate signals for short-term trades. Here are some key considerations to help you choose the best MACD settings:
- Shorter period EMAs: For a 5-minute chart, it’s recommended to use shorter period exponential moving averages (EMAs) to capture fast-moving trends. Consider using a 5-period EMA for the MACD calculation.
- Smoothing signal line: Since 5-minute charts are quite volatile, it’s beneficial to use a shorter period for the signal line. A 3-period EMA for the signal line can help filter out noise and provide clearer trading signals.
- Trend confirmation: To confirm the trend on a 5-minute chart, you can use a longer period EMA, such as a 20-period or 50-period EMA. The crossover of the MACD line and the longer period EMA can serve as a reliable confirmation of the trend direction.
- Flexibility: Keep in mind that market conditions may change, and what works for one cryptocurrency or timeframe may require adjustments for others. It’s essential to be flexible and adapt your MACD settings based on the specific market and asset you are trading.
By fine-tuning the MACD settings for a 5-minute chart, you can increase your chances of identifying profitable trading opportunities within shorter timeframes. Remember to backtest different settings and assess their effectiveness before implementing them in your live trading strategy.
MACD Settings for Day Trading
Day trading requires a specific approach when it comes to MACD settings. When selecting the MACD settings for day trading, it is essential to consider the time frame you will be trading on. Generally, shorter time frames require faster settings to capture intraday price movements effectively.
- Shorter Moving Average Period: For day trading, it is recommended to use a shorter moving average period, typically between 5 and 20. This helps to analyze short-term price trends and capture quick market movements.
- Smaller Signal Line Period: Since day trading focuses on short-term price actions, a smaller signal line period is preferable. A period of 3 to 9 is commonly used to generate faster signals for day traders.
- Adjusting the MACD Histogram: The MACD histogram represents the difference between the MACD line and the signal line. Day traders can fine-tune the histogram settings to identify intraday price reversals more effectively. Lower histogram settings, such as 1 or 2, can provide quicker and more precise signals.
- Testing and Refining: It’s crucial to remember that MACD settings for day trading can vary depending on the specific cryptocurrency and market conditions. Therefore, it is recommended to test different settings and refine your strategy based on your experience and the results obtained.
By adjusting the MACD settings for day trading, traders can better analyze short-term price movements, identify trends, and capture profitable opportunities within the trading day. Remember to use these settings as a starting point and tinker with them to suit your trading style and preferences in the dynamic cryptocurrency market.
Using MACD Along with Other Indicators
The MACD indicator is effective when used in combination with other technical indicators, enhancing its potential to identify profitable trading opportunities. Here are some popular indicators that can be used alongside MACD:
- RSI (Relative Strength Index): The RSI helps to determine the overbought and oversold levels of an asset. Combining MACD with RSI can provide confirmation and increase the accuracy of trading signals.
- Bollinger Bands: Bollinger Bands show the volatility and price levels of an asset. When used with MACD, Bollinger Bands can help identify potential price reversals or breakouts.
- Stochastic Oscillator: The Stochastic Oscillator helps identify price momentum and potential trend reversals. Utilizing MACD in conjunction with the Stochastic Oscillator can provide additional confirmation for trading decisions.
- Moving Averages: Using moving averages in combination with MACD can provide further insight into the overall trend. Traders often use the 50-day and 200-day moving averages along with MACD to confirm trend direction.
By incorporating these indicators into your MACD trading strategy, you can gather multiple perspectives on price movements and increase the reliability of your trading signals. Experimenting with different combinations and finding the indicators that work best for your trading style and preferences is key to maximizing your trading success.
Check our article: Fibonacci Trading Strategy: A Powerful Approach for Crypto Trading
Mastering MACD Signal Line Crossovers
One of the key techniques to master in MACD trading strategy is understanding and utilizing signal line crossovers. Signal line crossovers occur when the MACD line crosses above or below the signal line, indicating potential buy or sell signals.
When the MACD line crosses above the signal line, it generates a bullish signal, suggesting that it may be a good time to enter a long position. Conversely, when the MACD line crosses below the signal line, it generates a bearish signal, indicating that it may be a good time to consider a short position.
It is important to wait for a confirmed crossover, rather than relying solely on initial indications. This means waiting for the candlestick or price bar to close above or below the signal line, confirming the crossover. This helps to reduce false signals and increase the reliability of the trading strategy.
Use additional indicators or techniques to confirm the signal line crossovers. For example, look for convergence or divergence between the price action and the MACD indicators to validate the crossover signals. By combining multiple factors, you can increase the probability of successful trades.
It is worth noting that the effectiveness of signal line crossovers may vary depending on market conditions. They tend to work better in trending markets, where the price is consistently moving in one direction. In choppy or sideways markets, signal line crossovers may produce less reliable signals.
Utilizing MACD Histogram for Price Confirmation
The MACD histogram can confirm price movements and help you make informed decisions. It provides a visual representation of the difference between the MACD line and the signal line, allowing you to identify potential entry and exit points in the market.
When the MACD histogram is positive, it indicates that the MACD line is above the signal line, suggesting bullish momentum. Conversely, when the histogram is negative, it signifies that the MACD line is below the signal line, indicating bearish momentum.
To utilize the MACD histogram for price confirmation, wait for confirmation from the histogram before taking action. For example, if the MACD line crosses above the signal line, creating a positive histogram, you may consider entering a long position. Conversely, if the MACD line crosses below the signal line, creating a negative histogram, you may consider entering a short position.
Additionally, look for divergences between the price and the MACD histogram. A bullish divergence occurs when the price forms a lower low while the histogram forms a higher low, suggesting a potential trend reversal to the upside. Conversely, a bearish divergence occurs when the price forms a higher high while the histogram forms a lower high, indicating a potential trend reversal to the downside.
It’s important to note that, while the MACD histogram can provide valuable insights, it should not be used as the sole indicator for making trading decisions.
Exploring Divergence with MACD
Divergence analysis is a powerful technique that can provide valuable insights when using the MACD indicator for cryptocurrency trading. Divergence occurs when the price of an asset and the MACD indicator move in opposite directions, indicating a potential trend reversal or continuation.
There are two types of divergence: positive divergence and negative divergence. Positive divergence happens when the price reaches a lower low, but the MACD indicator forms a higher low. This suggests that bullish momentum may be building, and a trend reversal to the upside could be imminent.
On the other hand, negative divergence occurs when the price reaches a higher high, but the MACD indicator forms a lower high. This signals potential bearish momentum and a possible trend reversal to the downside.
Use the MACD convergence divergence as a confirmation tool alongside other technical indicators. For example, if the MACD convergence divergence signals a bullish reversal and the RSI (Relative Strength Index) also indicates oversold conditions, it can strengthen the likelihood of a trend reversal. Conversely, if both indicators confirm a bearish convergence, it can provide a stronger indication of a potential downtrend.
It’s important to note that the MACD convergence divergence should not be used in isolation but in conjunction with other indicators and analyses. It’s recommended to combine it with factors like price action, volume, and trend lines to increase the accuracy of trading decisions.
Tips for Successful MACD Trading
Here are some valuable tips to help you maximize your success when using the MACD trading strategy:
- Patience is key: Avoid jumping into trades based solely on MACD signals. Wait for confirmation from other indicators or price action before entering a trade.
- Use multiple time frames: Analyze the MACD signals on different time frames to get a clearer picture of the overall trend and potential entry and exit points.
- Combine MACD with other indicators: Enhance your analysis by using MACD in conjunction with other technical indicators such as RSI, moving averages, or trend lines.
- Monitor volume: Pay attention to volume patterns when interpreting MACD signals. Strong volume accompanying MACD crossovers or histogram reversals can provide confirmation for your trades.
- Set realistic profit targets and stop-loss orders: Define your risk-to-reward ratio and establish clear exit points to protect your capital and minimize losses.
- Practice risk management: Don’t risk more than a small percentage of your trading capital on a single trade. Diversify your portfolio and use proper position sizing.
- Keep an eye on market conditions: Be aware of overall market trends and news events that could impact the cryptocurrency market. Adjust your trading strategy accordingly.
- Stay disciplined: Stick to your trading plan and avoid impulsive decisions based on emotions or short-term market fluctuations. Trust in your analysis and follow your rules consistently.
- Backtest and analyze your trades: Evaluate your past trades to identify patterns and improve your strategy over time. Learn from your mistakes and capitalize on your successes.
- Utilize the CScalp free trading platform: Take advantage of the features and tools offered by the CScalp trading platform, such as real-time market data, customizable charts, and advanced order types to swiftly execute your trades using MACD trading strategy.
Combining MACD Trading Strategy with the CScalp Free Scalping Terminal
When it comes to maximizing the potential of your MACD trading strategy, one powerful tool to consider is the CScalp. The platform offers a range of features that can enhance your trading experience and help you make more informed decisions.
One of the key advantages of using CScalp is its ability to provide real-time market data. This means that you can stay up-to-date with the latest price movements and react quickly to changes in the market. The platform also offers advanced order placement options, allowing you to execute trades with precision and efficiency.
Additionally, CScalp provides robust risk management tools. These features can help you manage your risk effectively and protect your trading capital.
Implementing your MACD trading strategy through the CScalp professional free trading platform can significantly enhance your trading experience. By leveraging the platform’s features, you can gain deeper insights into market trends, execute trades quicker and more efficiently, as well as effectively manage your risk. Take advantage of this powerful tool and elevate your MACD trading to new heights.
Join the CScalp Trading Community
Join our official trader's chat. Here you can communicate with other scalpers, find trading soulmates and discuss the market. We also have an exclusive chat for crypto traders!
Don't forget to subscribe to our official CScalp news channel, use trading signals and get to know our bot.
If you have any questions, just contact our platform's support via Telegram at @CScalp_support_bot. We will respond in a matter of seconds.
You can also visit our Discord channel and subscribe to the CScalp TV YouTube channel.
JOIN OUR CHAT