
How Charts Work in CScalp
Date of update: 13.01.2025
We have prepared a guide on working with charts in CScalp. Learn how to open and configure charts in the trading terminal. We will also discuss chart features.
Attention! This article is for informational purposes only and does not contain recommendations or calls to action.
The review has been prepared by the CScalp terminal team. You can get CScalp by leaving your e-mail in the form below.
How to Open Charts
You can open an instrument’s chart from the order book. Left-click on the “Open Chart” button. The button is located to the left of the order book, above the trade tape. The instrument’s chart will open.
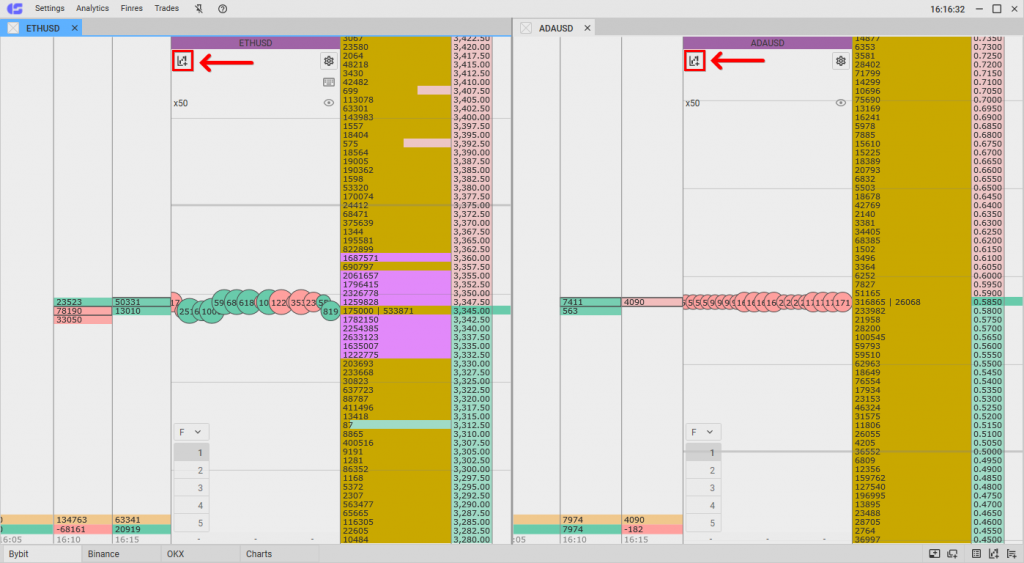
Click on “Add Chart” above the trade tape to open the chart of the selected instrument
A chart can be linked with the order book into a single group. If you change the instrument in the chart/order book, the instrument will automatically change in the order book/chart accordingly. Color coding is used for link management. Mark the desired windows with one color, and the terminal will “remember” that they are linked.
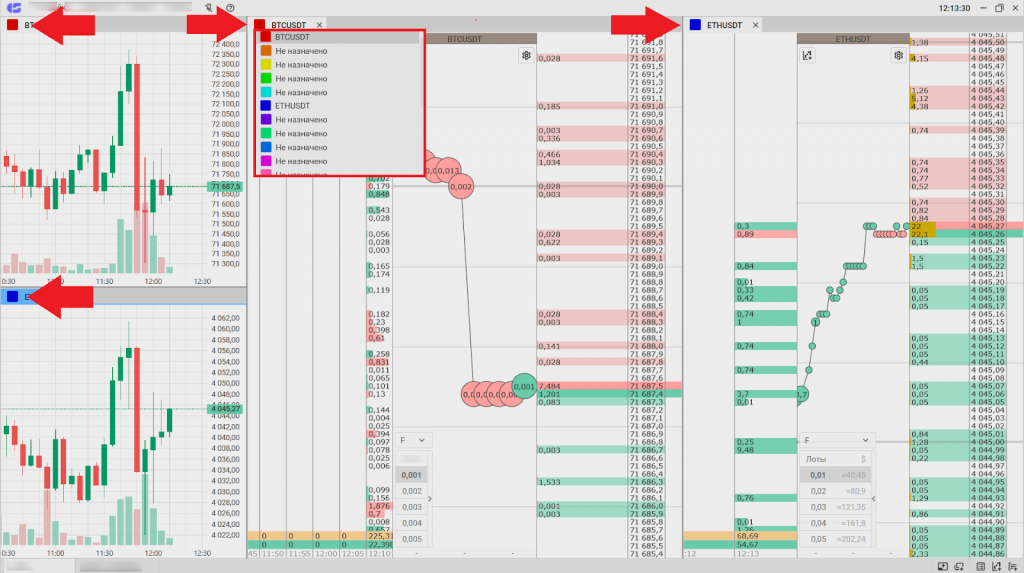
Click on the cell with the color indicator on the instrument tab. Then, select the same color in the corresponding tab for another window you want to link
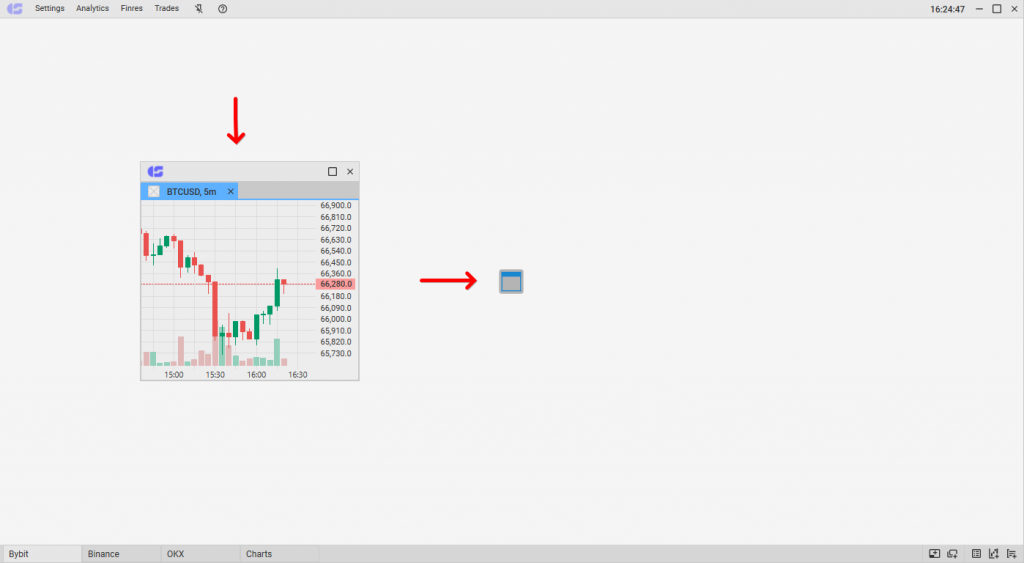
Let’s look into another way to open a chart. When creating a new tab, an empty workspace will open. To open a chart, click on the “Add Chart” button in the center of the screen or from the context menu (bottom right corner).
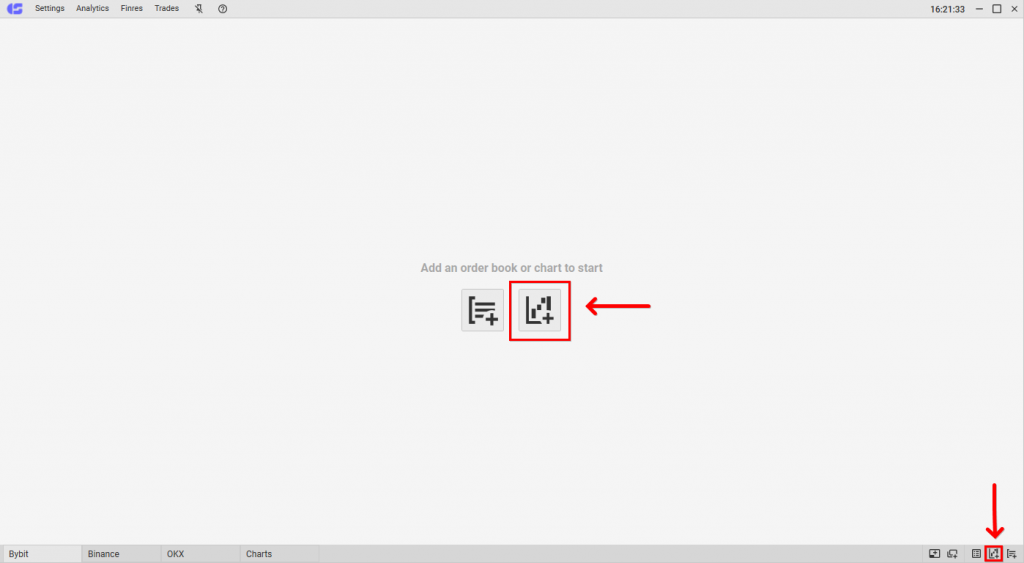
Click the “Add Chart” button in the center of the workspace or in the bottom right corner
An empty chart window will open. Specify which instrument’s chart needs to be displayed in the window. To do so, click on the “+”.
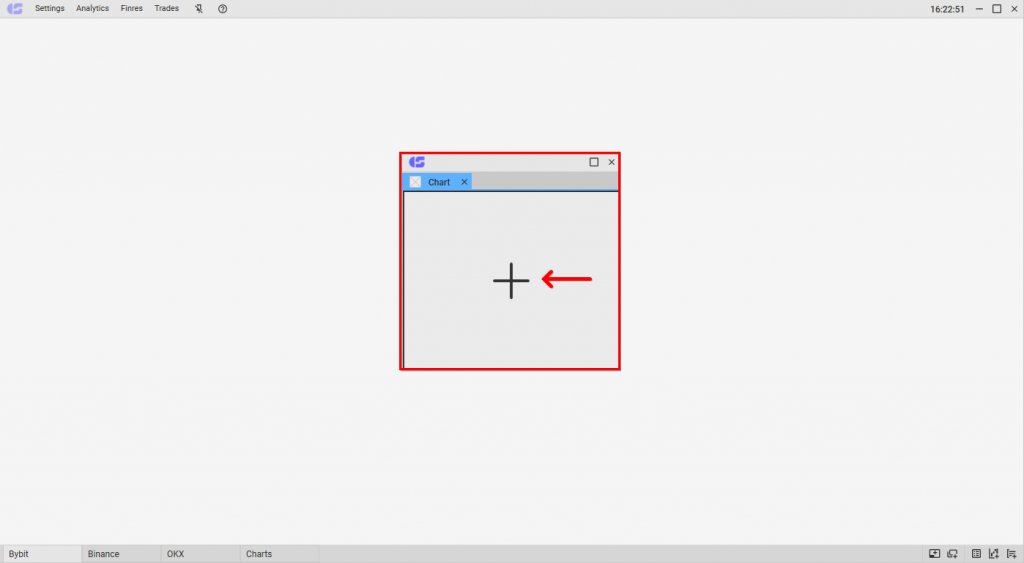
Empty chart window. Click “+” to choose which instrument’s chart to display in the window
The “Tickers” window will open. On the left side, select the necessary connection. Then choose the type of instrument below. A list of available instruments for the chosen connection will appear. To open the chart of an instrument, double-click the left mouse button (LMB) on the ticker in the list, or drag the required ticker into the empty window.

Select the connection, instrument groups, and the ticker from the list. Double-click LMB on the required ticker
The chart of the selected instrument will open in a small window. The window can be expanded or minimized (like a regular window in Windows). To “dock” the window with the chart into the workspace, press and hold the LMB on the window and drag it to the desired place. When holding the LMB on the window, docking markup (blue squares) will appear in the terminal. When you hover the cursor with the window over the desired cell in the docking markup, release the LMB.
The chart window appeared. You can change its size or use docking to place the window in the workspace. To do so, press and hold the LMB on the window and drag it into the docking markup
To change the instrument, click on the ticker name in the chart window.
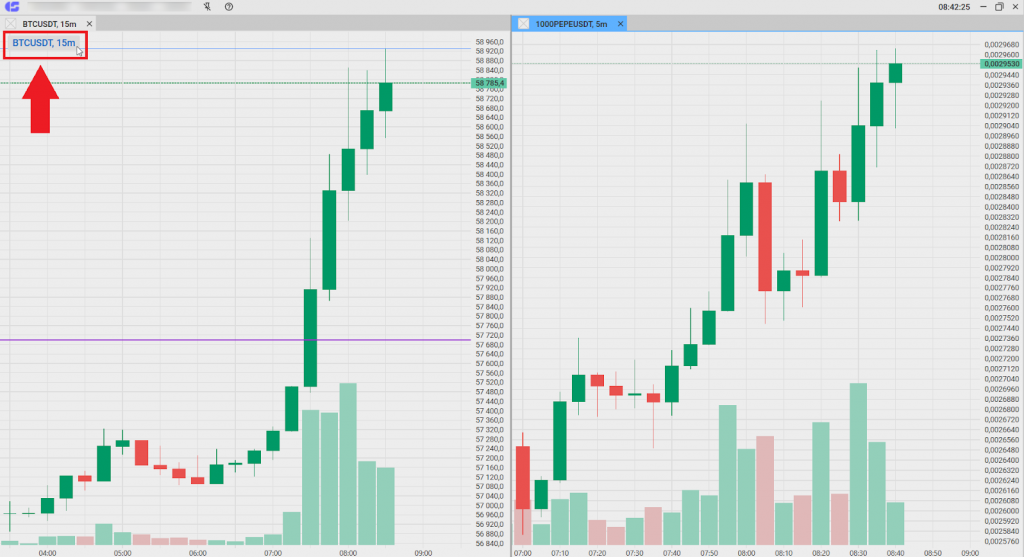
The ticker name is located in the left corner of the chart window
The “Tickers” window will open. Select the connection, the group of instruments, and double-click LMB on the required ticker.
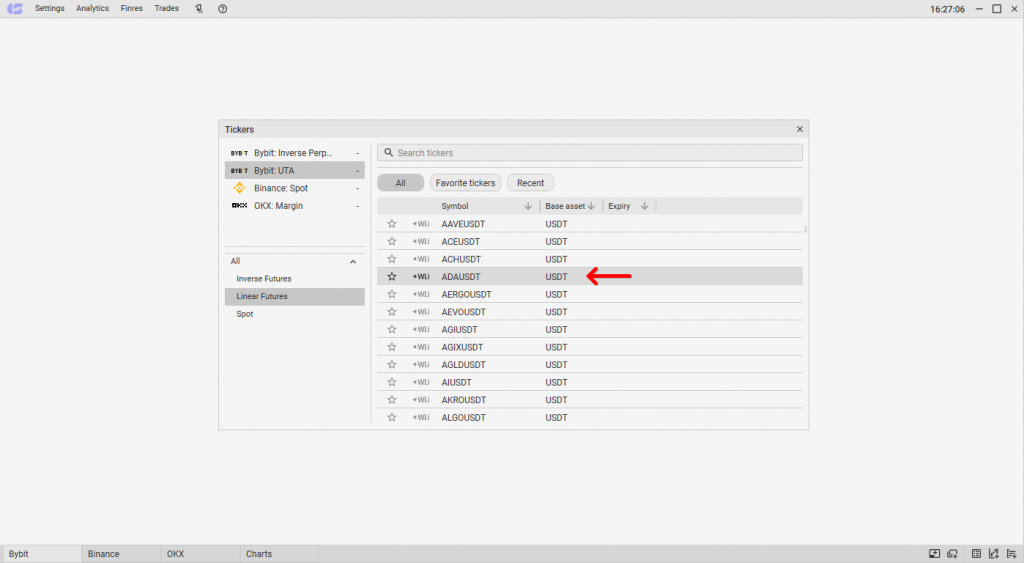
Select the necessary connection and the group of instruments below. Then double-click LMB on the required ticker to open its chart
Chart Features
In the CScalp trading terminal, candlestick and bar charts are implemented. They also feature a volume indicator. You can open the chart of any instrument on the chosen connection. Up to 60 charts can be opened in CScalp simultaneously.
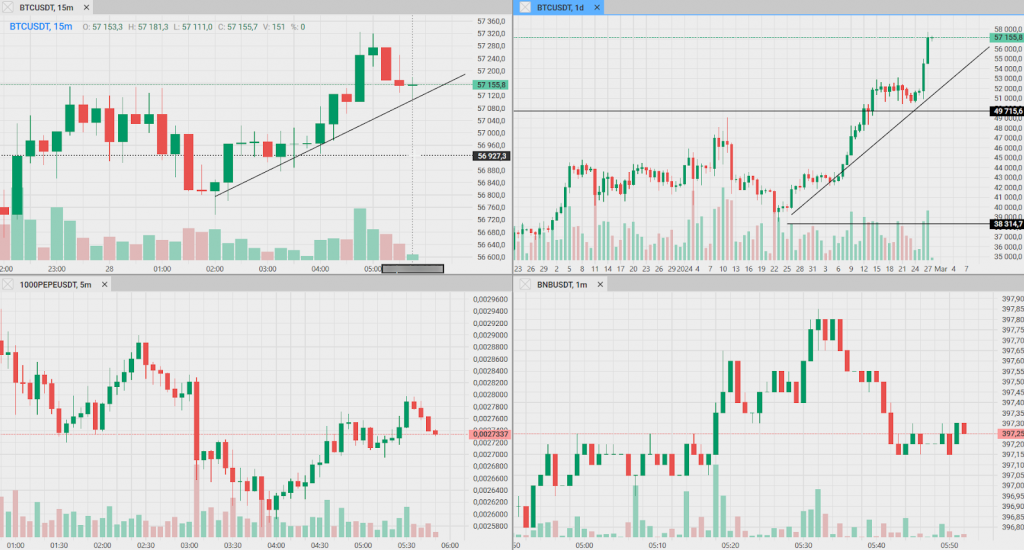
Charts in the CScalp terminal interface
Each chart is displayed in a separate window, which can be minimized/maximized, embedded in the workspace, or opened separately. Thanks to the docking feature, charts snap to each other and order books. This allows for efficient use of workspace and window placement at your discretion.
Figures and Timeframes
To open the toolbar, hover over the top part of the chart window. The toolbar includes a selection of figures for drawing, timeframes, a button to return to the default chart scale (circular arrow), and a button to delete elements drawn on the chart (trash can).
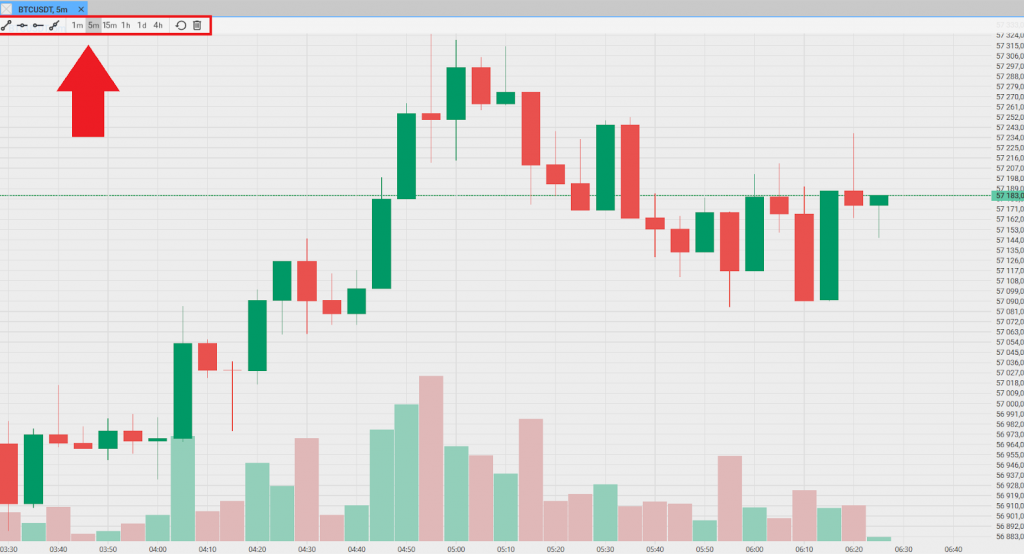
The toolbar at the top of the chart window
Figures and drawing tools are necessary for technical analysis. The CScalp terminal charting tools include:
- Line
- Rectangle
- Ray
- Horizontal line
- Horizontal ray
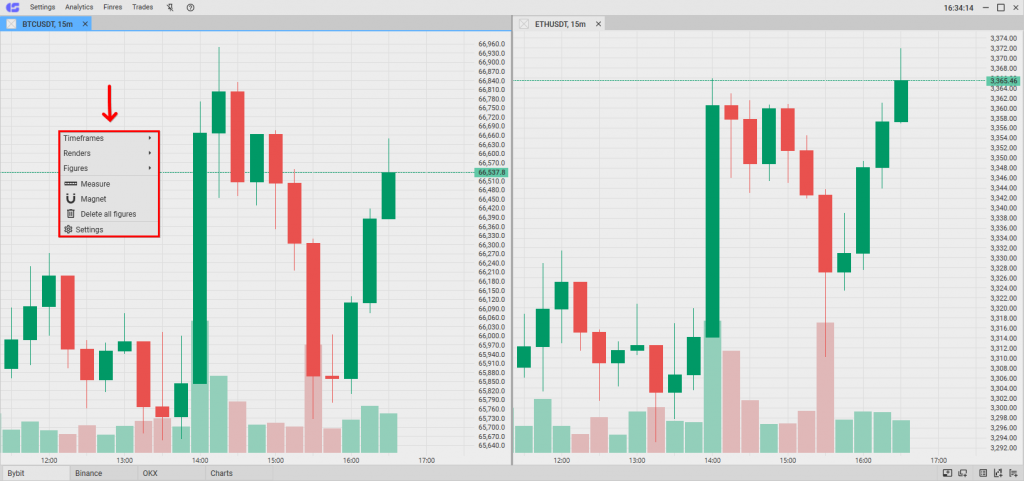
You can also access figures by right-clicking in the chart window and selecting “Figures” from the context menu.
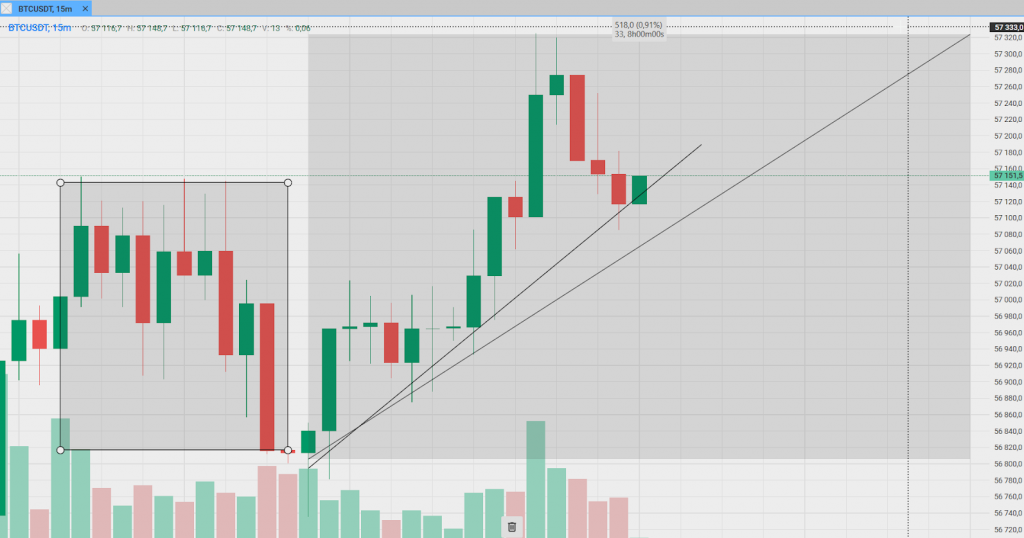
Figures, lines, and the “Measure” tool in CScalp
The timeframe switcher is located on the toolbar and works with one click. Available timeframes are 1m, 5m, 15m, 1h, 4h, and 1d. In settings, you can specify which timeframes to display on the toolbar. The second method of managing timeframes is through the context menu (right-click on the chart and navigate to the “Timeframes” subsection).
Chart settings set via the toolbar are saved for all charts (except for the “Magnet” and “Display Min/Max for 2 days” options).
To add a ruler (“Measure“) to the chart, use the “Shift” hotkey. Hold the hotkey, hover the cursor over the desired chart, click LMB to mark the start of the ruler, and drag the cursor to the needed point. Then click LMB on the chart to “fix” the ruler.
You can open several charts for one instrument (e.g., BTCUSDT) and set different timeframes for them. If you close the chart window or turn off the terminal, the settings will be saved and available upon restart. Learn more about chart settings below.
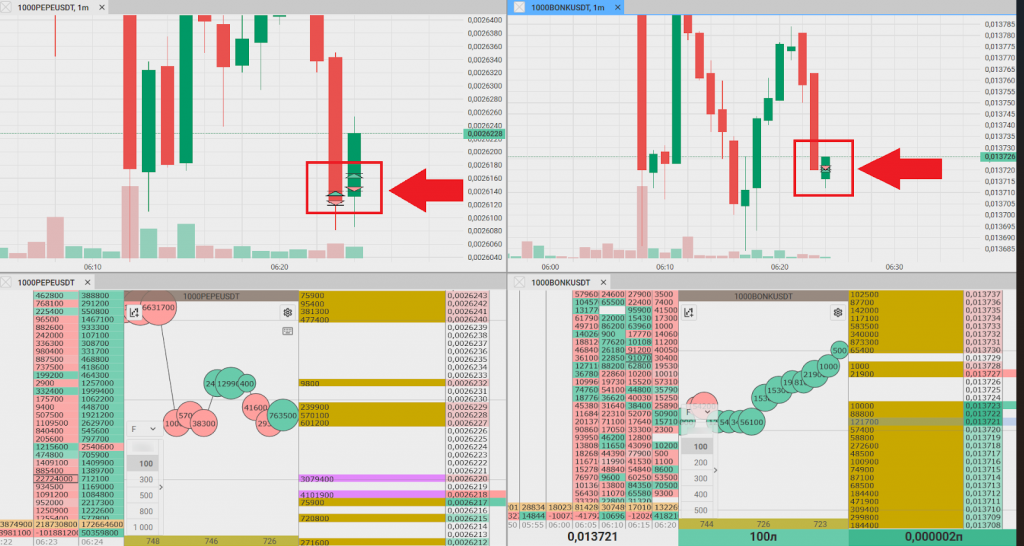
Order books and charts are synchronized. If you open/close a position in the order book, a corresponding mark will appear on the chart
The chart and order book are synchronized. If a user opens or closes a position in the order book, corresponding marks will be displayed on the chart (this option can be managed in settings).
Volume Indicator
A volume indicator is placed in the chart window. The indicator looks like two “columns” of two colors. A green column means the corresponding candle on the chart went up (buyers dominate). A red column means the corresponding candle on the chart went down (sellers dominate). The larger the volume collected over the timeframe, the higher the indicator column.
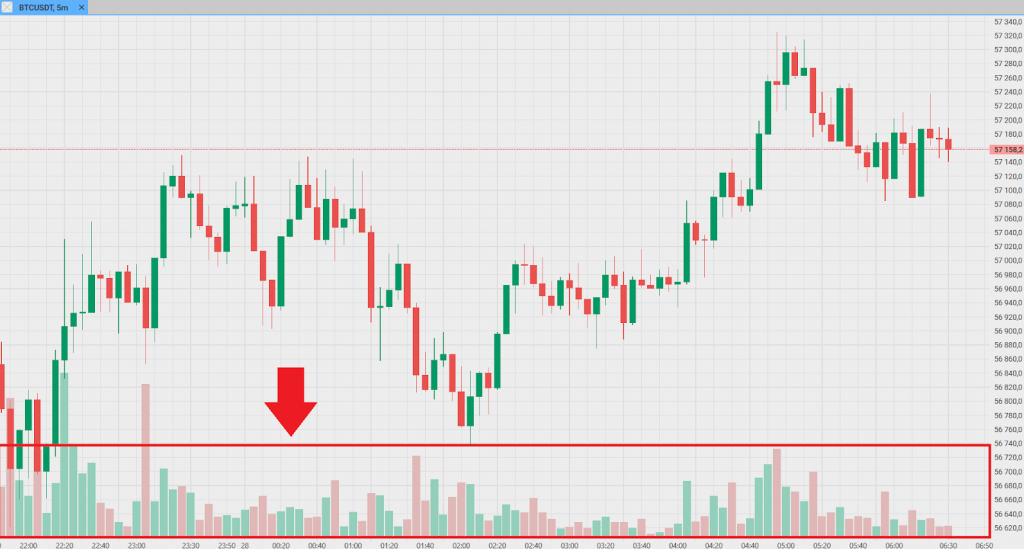
Volume indicator in the CScalp terminal
The colors of the indicator can be changed in the “Settings” menu, “Display” section. You can also switch the indicator from two-color mode to monochrome in the chart settings (more details below).
Simplified and Standard Modes
CScalp charts support two modes: standard and simplified. In simplified mode, dates and times are not displayed at the bottom of the chart, and there is no price level scale on the right side. Only the “badge” with the current price of the instrument is placed in the top right corner.
In simplified mode, candles, market price, buy/sell line of the instrument, grid markup, and volume indicator are displayed (the indicator and markup can be disabled in settings).
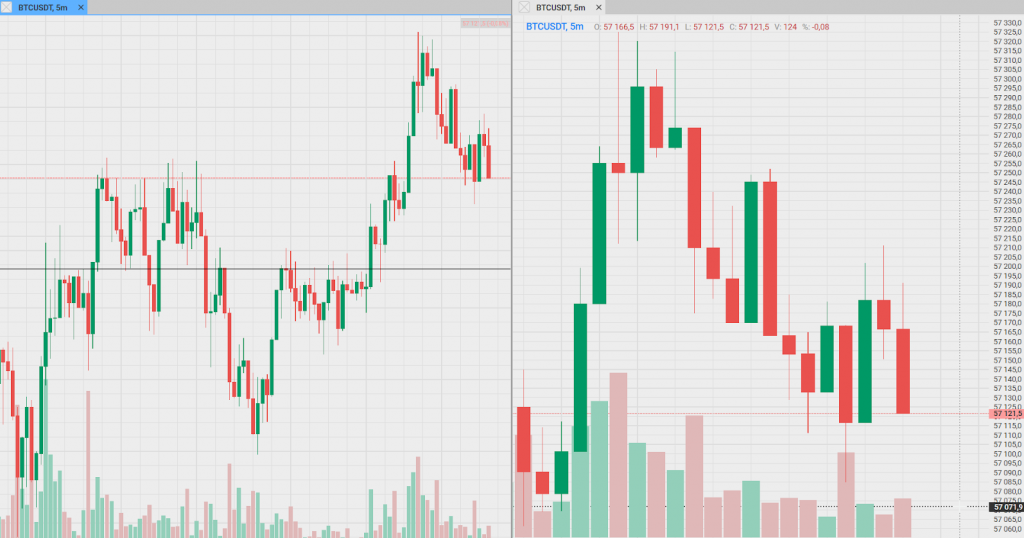
On the left side of the workspace, a chart is opened in simplified mode. On the right side, a chart in standard mode
By default, simplified mode is automatically activated when the user minimizes the chart window. In settings, you can change the transition to simplified mode or disable it.
How to Configure Charts
General Settings for All Charts
General settings are parameters that are set through the “Settings” menu item. These settings apply to all charts that are open in the terminal or will be opened later.
To go to the General settings, hover the cursor over the chart or a space in the chart window, right-click, and select “Settings” from the menu that appears.
To go to the general settings for charts, right-click in the chart window and select “Settings” option
Settings are divided into four groups:
- Ticker
- Simplified mode
- Amount panel
- Toolbar
In the “Ticker” group, you will find parameters that are responsible for displaying the instrument on the chart, as well as for auxiliary chart options.
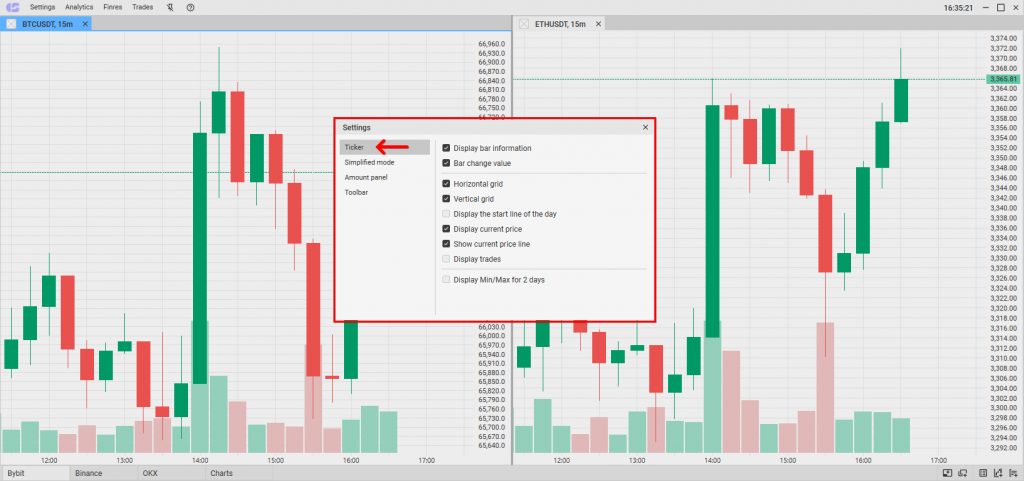
Individual chart settings: “Ticker” parameters
Available settings:
- Display bar information. Enables/disables the block with information about bars/candles, located at the top of the window
- Bar change value. Enables/disables the display of bar change in %
- Horizontal grid. Displays/hides the horizontal grid, located under the chart
- Vertical grid. Displays/hides the vertical grid, located under the chart
- Display the start line of the day. Enables/disables the black dotted line, showing the start of the trading day on the chart
- Display current price. Enables/disables “highlighting” of the current price on the price level scale
- Display current price line. Enables/disables the dynamic dotted line, which is located at the level of the current price
- Display trades. Shows/hides the prices at which the trader conducted transactions on the candlesticks
- Display Min/Max for 2 days. Shows/hides horizontal lines marking the price minimums and maximums for every two trading days. By default, the maximum is marked with a blue line, the minimum with a purple line
Note: the “Display Min/Max for 2 days” option is configured individually for each chart.
In the “Simplified Mode” group, you will find settings that are responsible for the simplified mode of charts in CScalp.
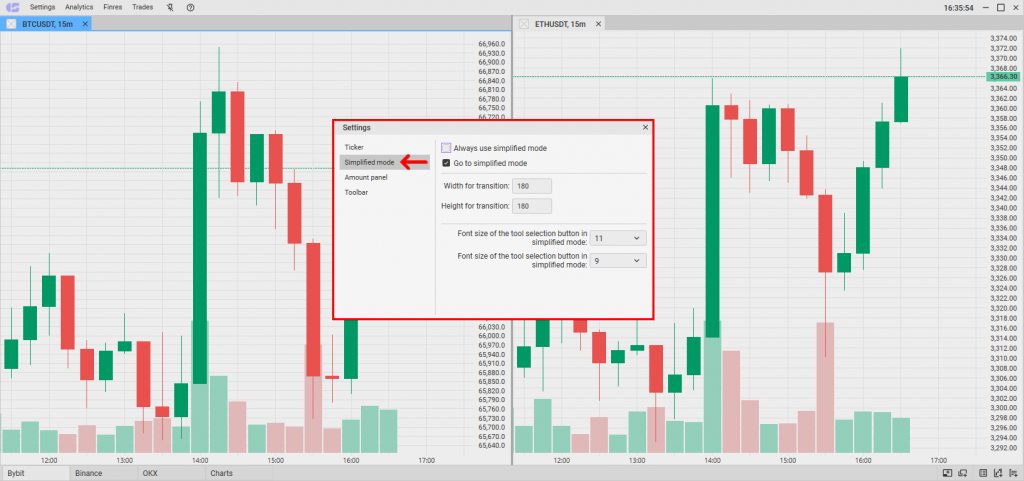
Individual chart settings: “Simplified Mode” parameters
Simplified mode settings:
- Always use simplified mode. If the parameter is enabled, any chart will always open only in simplified mode. If the parameter is disabled, it will open in standard mode
- Go to simplified mode. If the option is enabled, then when the chart window is minimized, the chart will switch to simplified mode. If the window is expanded, the chart will automatically switch to standard mode
- Width and height for transition. You can set the window size (in pixels) at which the chart will switch to simplified mode. If you minimize the window to the set sizes, the option will be activated. If you increase the window more than the set sizes, then the chart will switch to standard mode
- Font size of the tool selection button in simplified mode. Sets the font size that will be used for the instrument selection button, in the top left corner of the window
- Font size in simplified mode. Sets the font size that will be used for all text and numbers in simplified mode
The parameters of the “Amount panel” group are responsible for the volume indicator, placed under the chart.
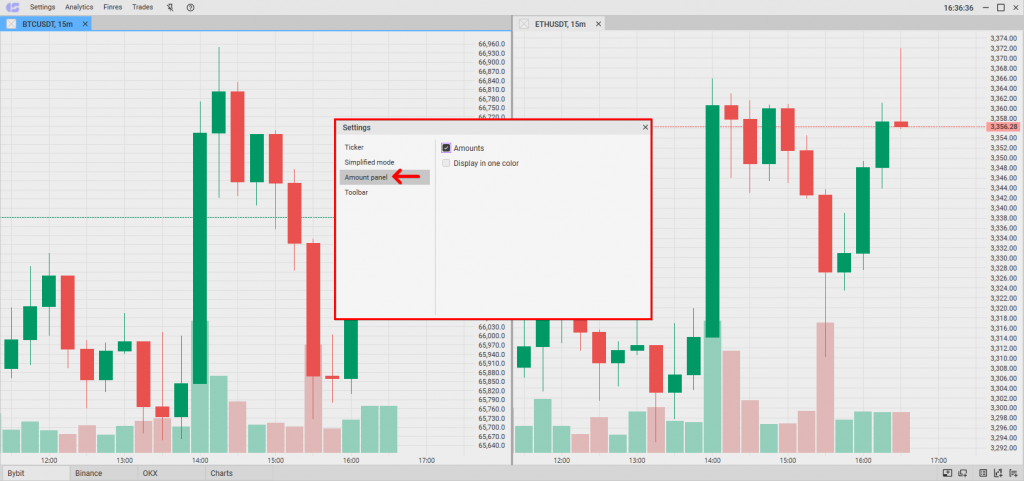
Individual chart settings: “Amount panel” parameters
Available settings:
- Amounts. Enables/disables the volume indicator on the chart
- Display in one color. This setting switches the indicator from two-color mode to monochrome mode. By default, green-red columns are colored in gray and vice versa, from gray to green-red scale. It is possible to customize the colors.
The “Toolbar” group’s parameters help to customize the toolbar, placed at the top of the chart window.
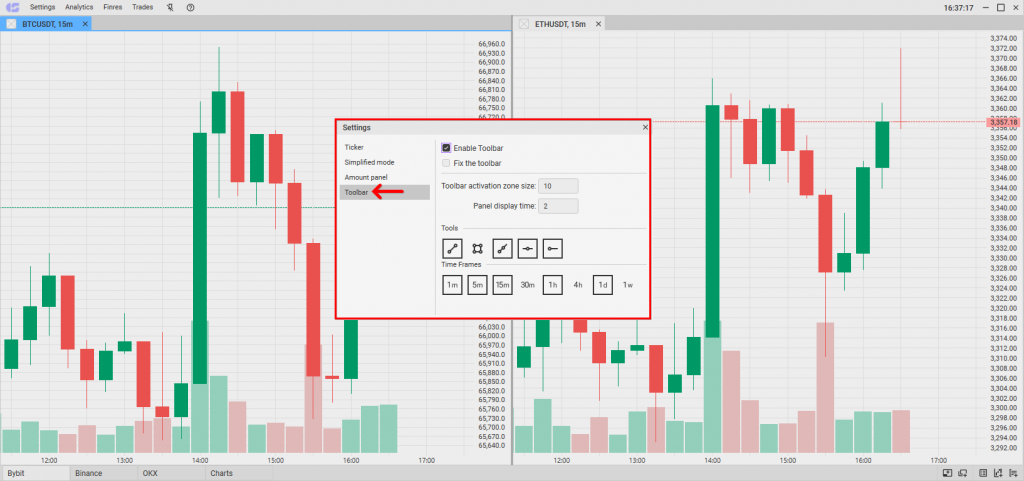
Individual chart settings: “Toolbar” parameters
Available settings:
- Enable Toolbar. Enables/disables the toolbar in the chart window. If the “check” is removed, the toolbar will not appear in the window
- Fix the toolbar. By default, the toolbar appears if you hover the cursor on the top edge of the window. The option allows you to fix the toolbar “permanently”
- Toolbar activation zone size. Adjusts how close to the top of the window you need to bring the cursor to make the toolbar appear. Displayed in pixels, the maximum value is 50
- Panel display time. Adjusts how long the toolbar will be displayed after you move the cursor away from it
- Tools. Adjusts the set of figures that will be available on the toolbar. To select/remove a tool, you need to click on it with LMB. Selected tools are marked with a black frame
- Time Frames. Sets the timeframes that will be available on the toolbar. To add/remove a timeframe, you need to click on it with LMB. Selected timeframes are marked with a black frame
General settings include visual parameters that can be set through the “Settings” section in the main menu (sub-section “Display“). If you change the color theme or customize the appearance of charts through the “Display” sub-section, this appearance will apply to all charts in the terminal.
Individual Chart Settings
Individual chart settings are settings that are set through the panel at the top of the chart window. Any parameters selected through the panel are saved only in this window. Individual settings can also be set through the context menu (by right-clicking on the chart).

For example, you can open three charts of DOGEUSDT. Set a separate timeframe for each – 1m, 15m, and 5m. If you change the timeframe in the first window, the timeframes in the second and third windows will be preserved. The windows are independent of each other. Suppose you have marked some moments on the chart with figures. If you draw something in two windows and click “Delete all figures” in the first window, the figures will be deleted only in the first window.
Join the CScalp Trading Community
Join our official trader's chat. Here you can communicate with other scalpers, find trading soulmates and discuss the market. We also have an exclusive chat for crypto traders!
Don't forget to subscribe to our official CScalp news channel, use trading signals and get to know our bot.
If you have any questions, just contact our platform's support via Telegram at @CScalp_support_bot. We will respond in a matter of seconds.
You can also visit our Discord channel and subscribe to the CScalp TV YouTube channel.
JOIN OUR CHAT