
How Clusters Work in CScalp
Date of update: 15.03.2024
The CScalp team has prepared instructions for working with clusters in the trading terminal. We explain what clusters are and how to use them in market analysis. We will also discuss cluster settings in the CScalp terminal.
Attention! This article is for informational purposes only and does not contain recommendations or calls to action.
The review has been prepared by the CScalp terminal team. You can get CScalp by leaving your e-mail in the form below.
What Are Clusters?
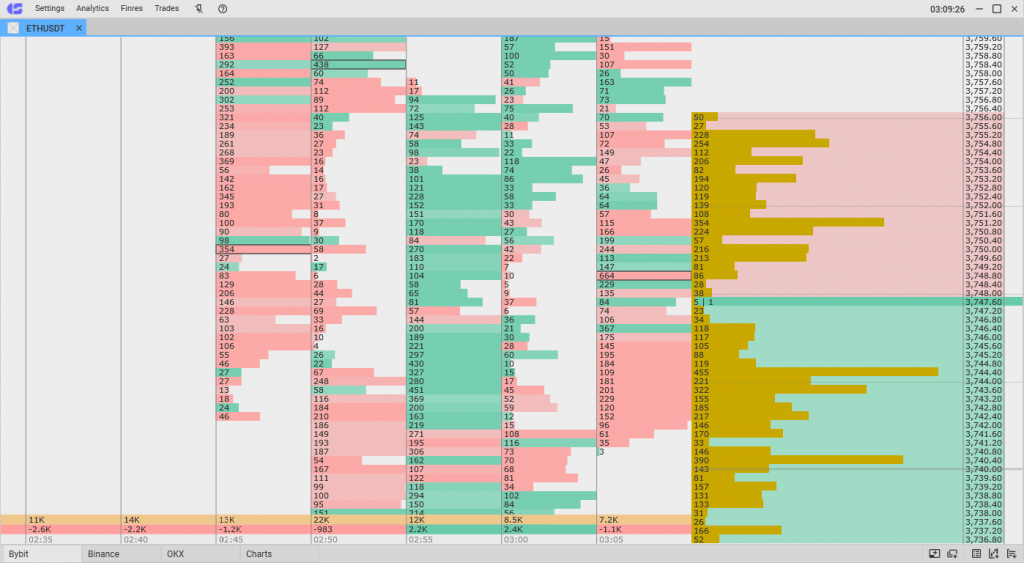
Clusters in CScalp are a tool for volume market analysis. It is a variation of the price chart where each candle is a vertical column. Within each column, price levels are laid out in rows. Inside each level, the traded volumes are shown.
CScalp clusters
Clusters provide a comprehensive picture of traded volumes at each price level over an n-time period. Clusters answer the questions:
- When?
- How much?
- At what price level?
- Who traded (seller/buyer)?
- With what lead over other participants?
Clusters in CScalp are an auxiliary tool. They allow confirming or refuting an already formed hypothesis. When trading through the terminal, a scalper primarily looks at the exchange order book, and then at the chart. After that, they look at the trade tape and clusters.
For more details on working with the trade tape and charts, read the articles “How the Trade Tape Works in CScalp” and “How Charts Work in CScalp.”
How Clusters Work
Each column of the cluster is a candle on the chart. In the CScalp terminal, clusters show up to 10 columns for any timeframe.
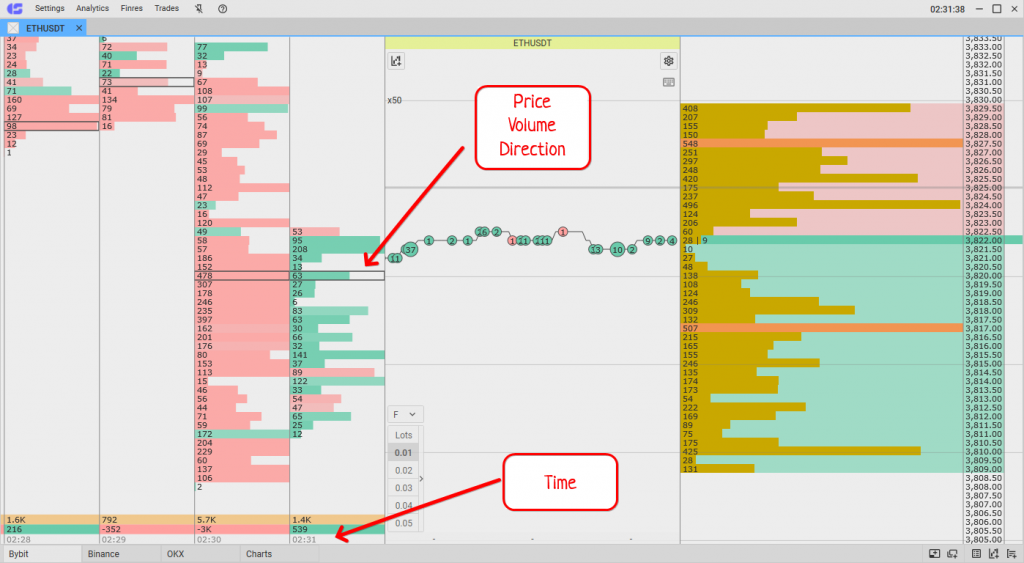
What clusters show
The bottom of the column indicates the opening time of the candle. Rows inside the column represent price levels within the candle.
Clusters, trade tape, and the order book
Clusters are filled with volumes from the trade tape. When orders are executed in the order book, they first appear in the tape and then “flow” into the clusters.
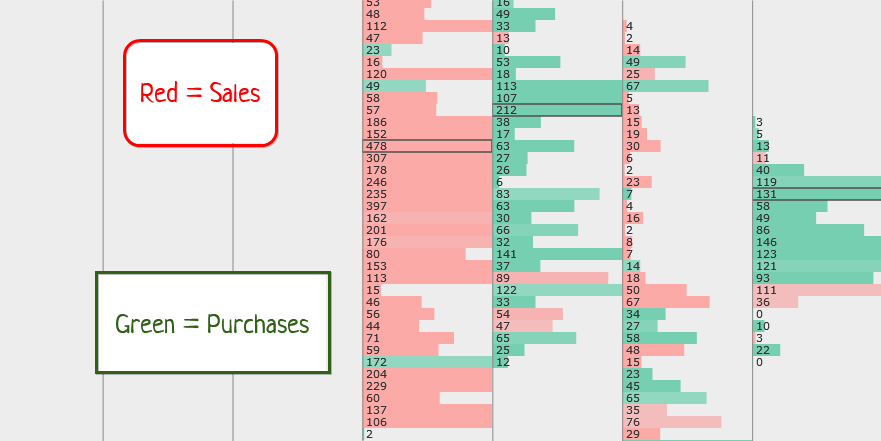
What the colors in clusters mean
Cluster rows are colored red (sales) or green (purchases). When a sell order in the order book is bought, the cluster is colored in the color of the counter order – green. When a seller is found for a buy order, the cluster is colored red. The more intense the shade, the more orders of one direction were at that level.
Imagine a single order for 5,000 lots “hanging” in the exchange order book. While the order is open, nothing happens in the tape or clusters. Then a counter order appears to buy all 5,000 lots. As soon as the order is bought, it disappears from the order book and appears in the trade tape. The open order closes and becomes “news.” Then the order’s volume appears in the cluster and becomes “history.” The more orders pass through the instrument, and the larger their volumes, the faster and denser the clusters are filled.
Now imagine that there is a buyer for 3,000 lots for the open order in the order book (5,000 lots). The order from the order book is executed for this volume. An order of 2,000 remains in the order book, and a transaction of 3,000 appears in the trade tape. Accordingly, in the clusters, a volume of 3,000 lots will be recorded at the price of the executed order – until new orders pass at this price.
CScalp clusters price in the order book
Like the trade tape, clusters visually follow the bid/ask price in the order book. Scrolling through the order book automatically scrolls the clusters as well. The price levels in the clusters correspond to the levels from the order book.
CScalp clusters and order book
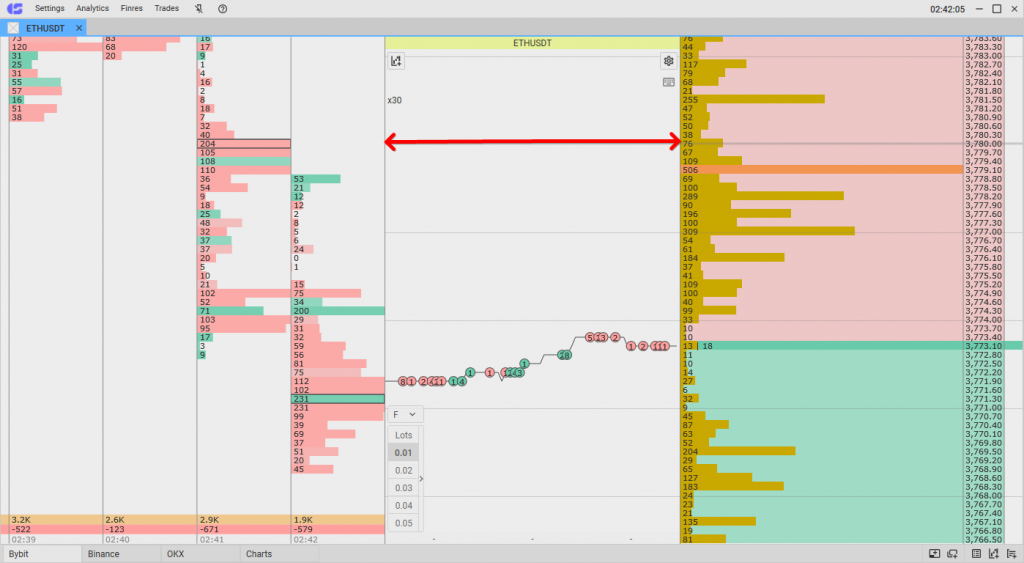
If a cluster column is vertically filled with rows, it means the price of the asset “moved” during that interval, and there were trades on all colored segments. The fullness of each row indicates how much volume was traded at each price level.
Price gap break in price cluster
Like the order book and chart, there can be gaps in the clusters – voids between price levels. If there were no volumes at some price within the candle, the cluster will be empty at that price.
Clusters total delta what they mean
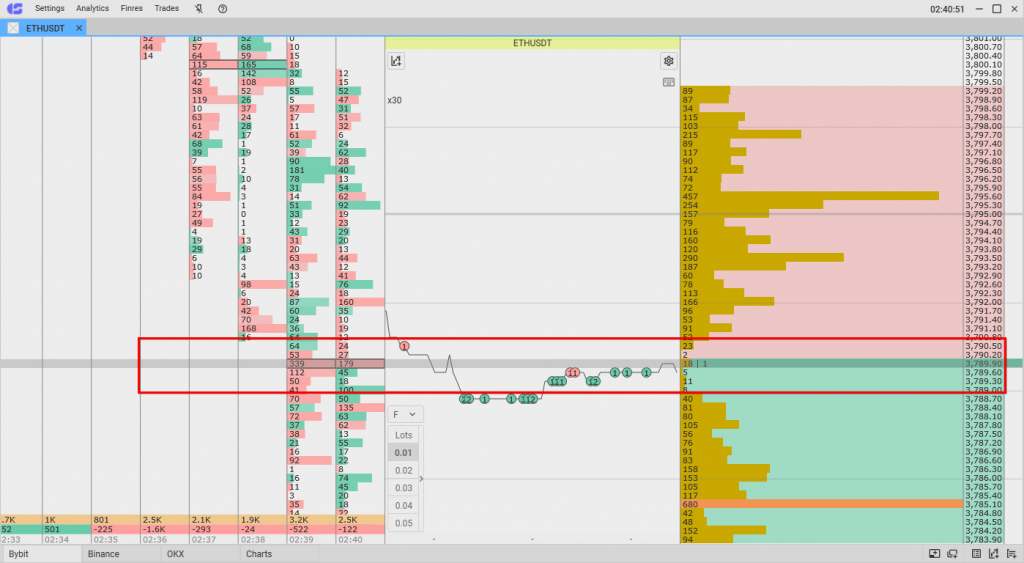
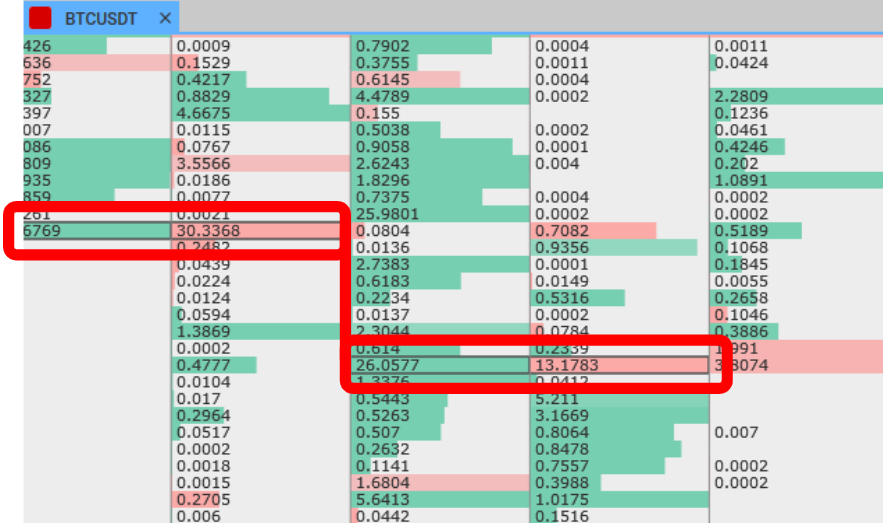
At the very bottom of the column, the total volumes on the candle (top row) and delta (bottom) are indicated. The sum is all volumes traded on the candle. The delta is the difference between the volume of purchases and the volume of sales.
How to Analyze Clusters
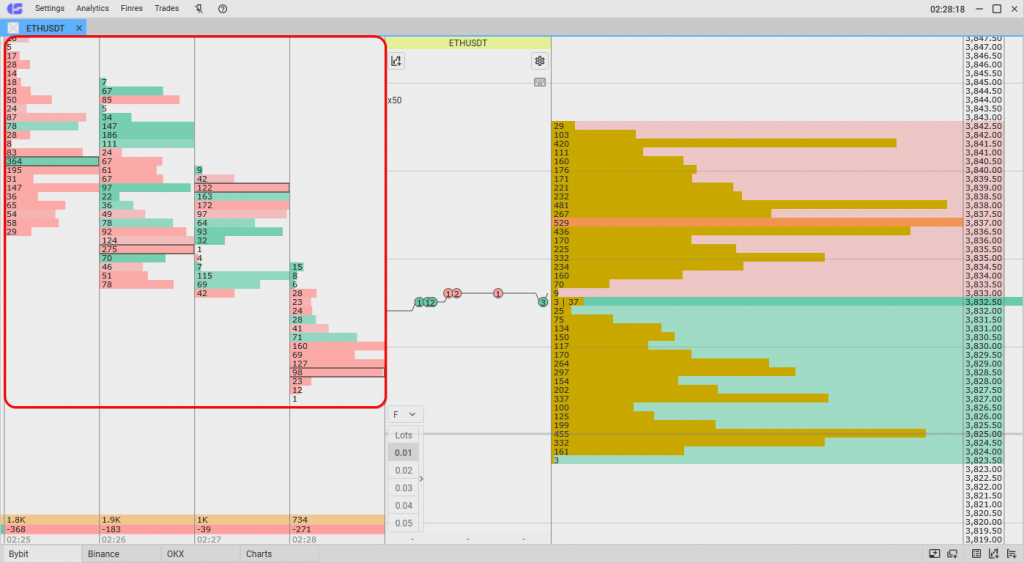
In the CScalp workspace, modules are arranged along a timeline, where the left represents the conditional past, the center represents the present, and the right represents the future.
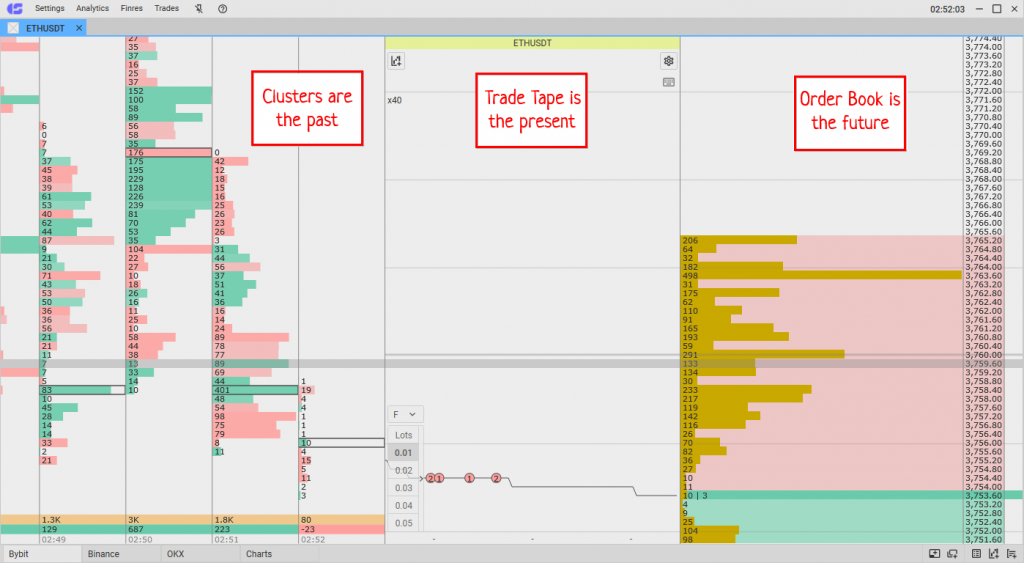
CScalp workspace
The order book (right) represents accumulations of volumes from the future. They have not yet been traded. The trade tape shows real-time transactions (present). Clusters represent past volumes. Clusters are also referred to as a footprint chart or a chart of volume “footprints.”
Analyzing clusters can be compared to the work of a tracker. We study the “tracks” of completed transactions and identify where, when, and how a major player “stepped.” In other words, where and how trades were conducted in the past. The “tracks” of volumes, combined with the readings from the order book and the chart, create a comprehensive picture of market direction.
How to analyze clusters in the CScalp terminal
Let’s consider the points that are of primary interest in cluster analysis.
Price Levels
Clusters help to understand at which price levels trades were occurring. These data can be correlated with the chart and order book to identify points of interest and reactions.
Trading Volumes
Densely filled clusters indicate recent high activity on the instrument. Accumulations and movements of volumes can confirm price levels from which a strong reaction is possible.
Balance of Buyers and Sellers
Understanding which side controlled the market at different price segments indicates the possible future direction of the price.
Delta
Changes and jumps in the delta can signal a change in market sentiment, and warn of possible reversals, or continuation of the trend.
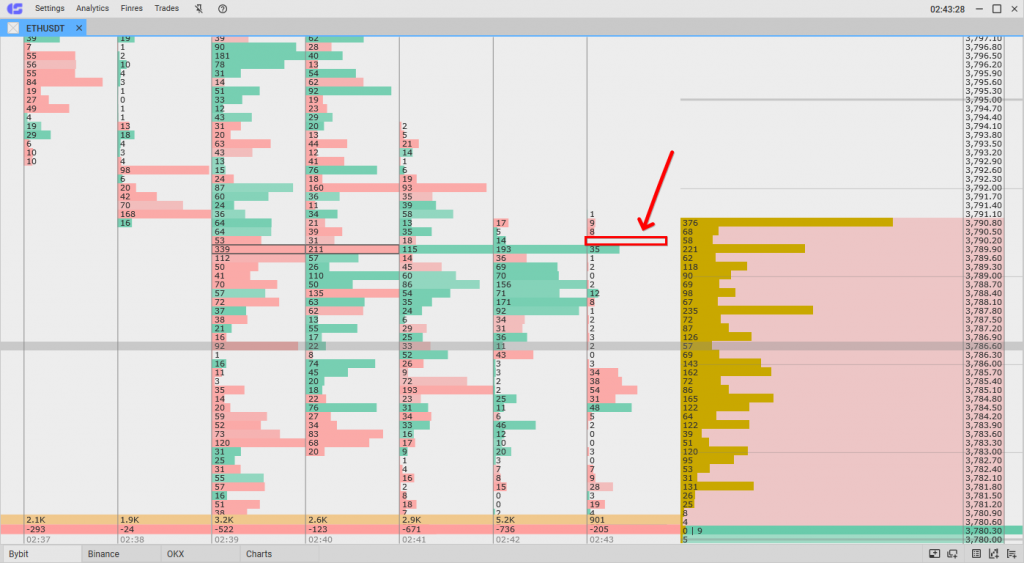
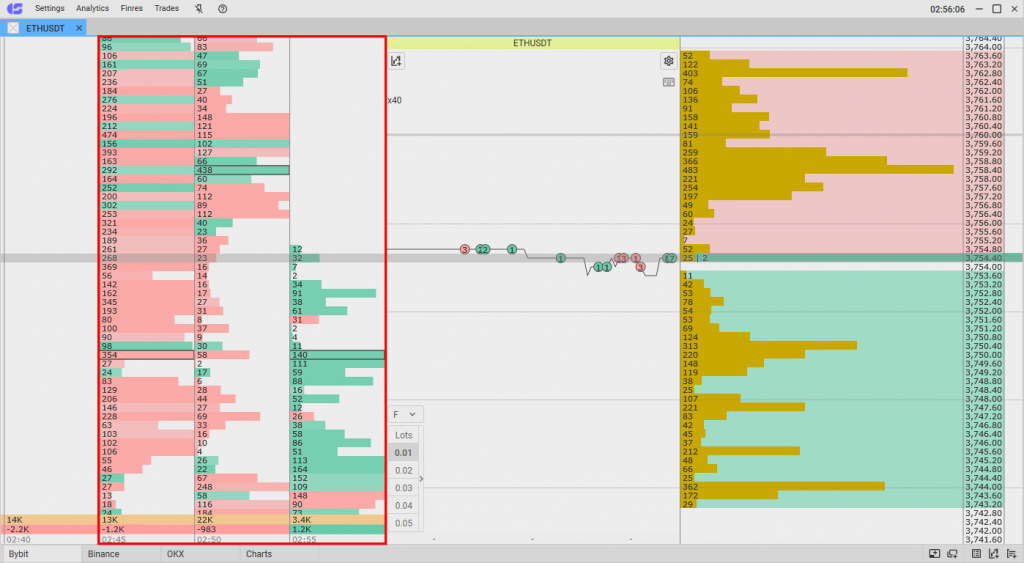
Points of Control (Point of Control/POC)
The point of control (POC) is the largest volume traded at the current or closed candle. It represents a past area of increased interest by major market participants.
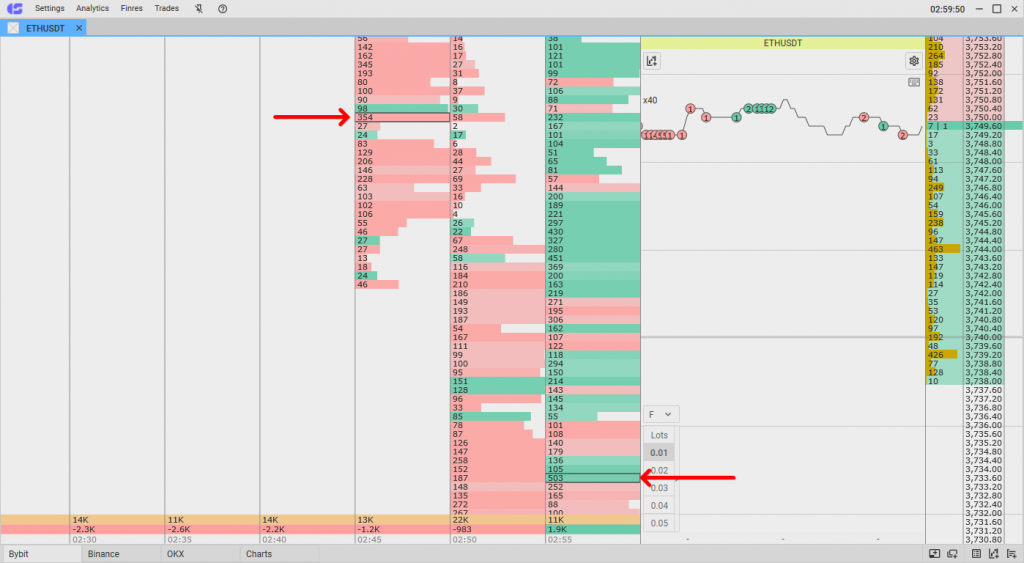
Point of control (POC)
The point of control in each candle is highlighted with a frame. POC is formed in real time on an open candle. As long as the candle is not closed, the position of POC can change. After the candle closes, POC is fixed. The position of the POC line does not depend on the degree of the “compression” of the order book.
POC patterns point of control cluster analysis
The gradual shifting of POCs can serve as an indicator of a trend change. Accumulations of POCs are similar to densities from the order book, only from the past. They can confirm key levels and points of reaction. The absence of such accumulations (chaotically scattered POCs) may, on the contrary, refute the hypothesis about densities and levels.
More about cluster analysis is discussed in the article “Cluster Analysis in Trading.”
How to Set Up Clusters
Let’s look at the cluster module settings in the CScalp terminal. Note that clusters are configured separately for each trading instrument. The terminal “remembers” user settings.
Click on the settings icon in the top right corner of the trade tape.
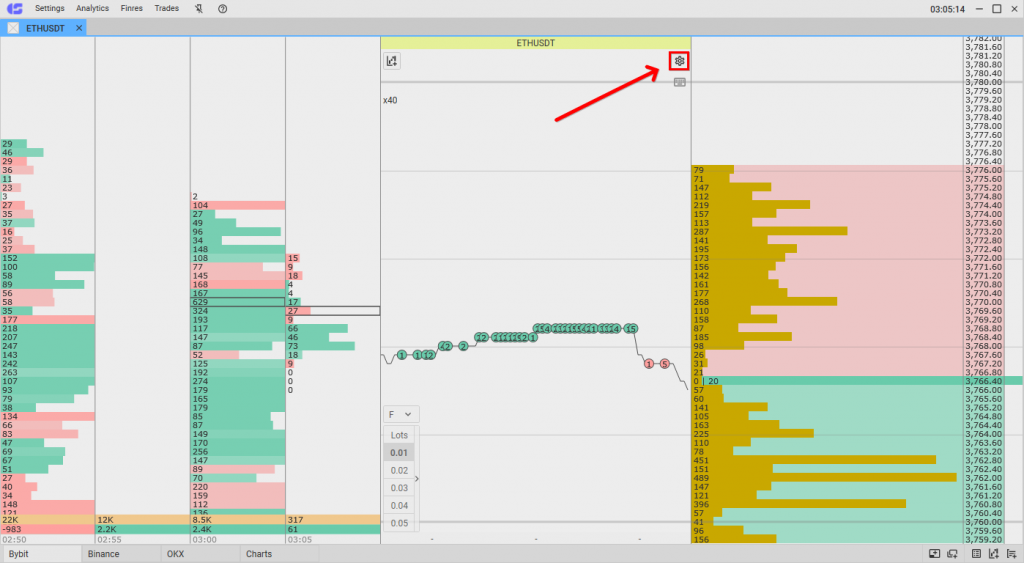
CScalp order book settings
Open the “Clusters” tab.
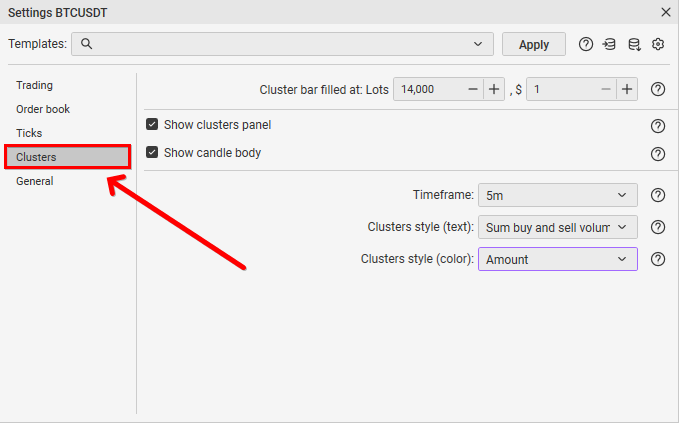
CScalp clusters setting
The “Show clusters panel” parameter enables/disables the display of the cluster module. If hidden, only the order book and trade tape will remain in the workspace.
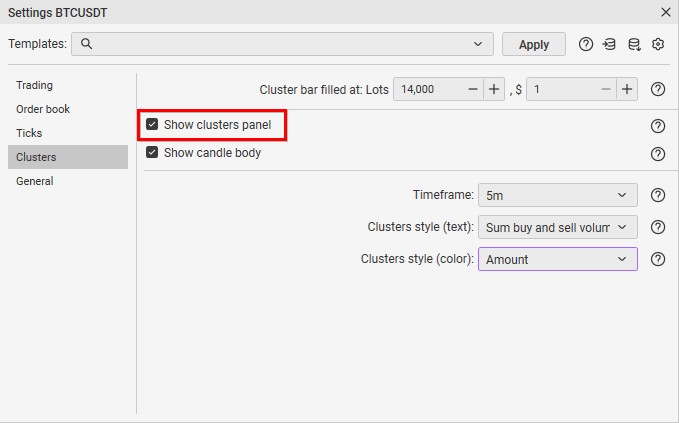
How to hide clusters in CScalp
Clusters also have an “Maximize/Minimize” option. To access it, right-click within the clusters.
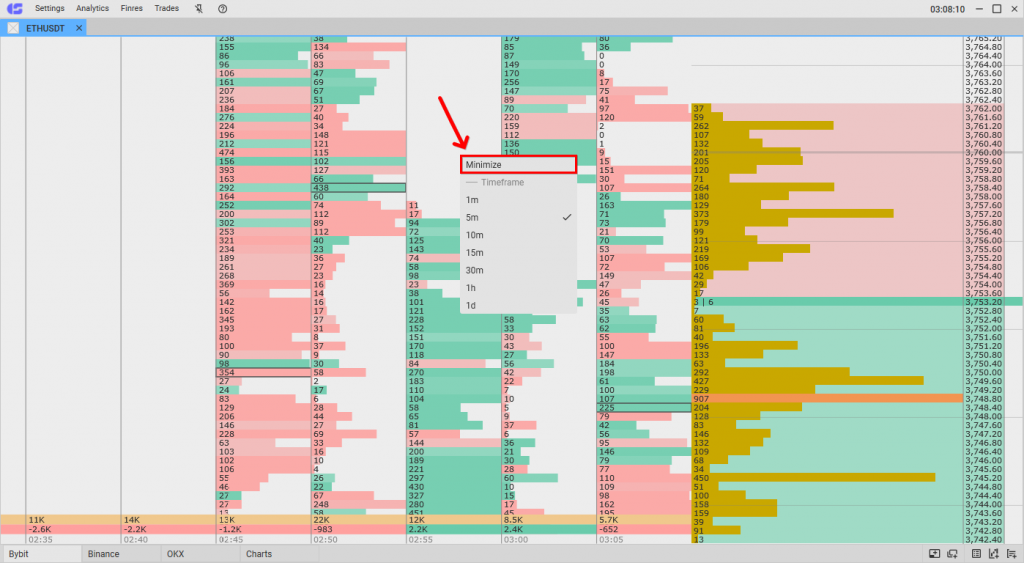
CScalp how to expand clusters
The “Maximize” setting expands the clusters but hides the trade tape.
Maximized clusters view in CScalp
When clusters are expanded, the settings icon is unavailable. Therefore, to configure the instrument, you need to collapse it first.
The “Cluster bar filled at” parameter sets the volume for full cluster filling. It allows filtering out “noise” in the instrument readings.
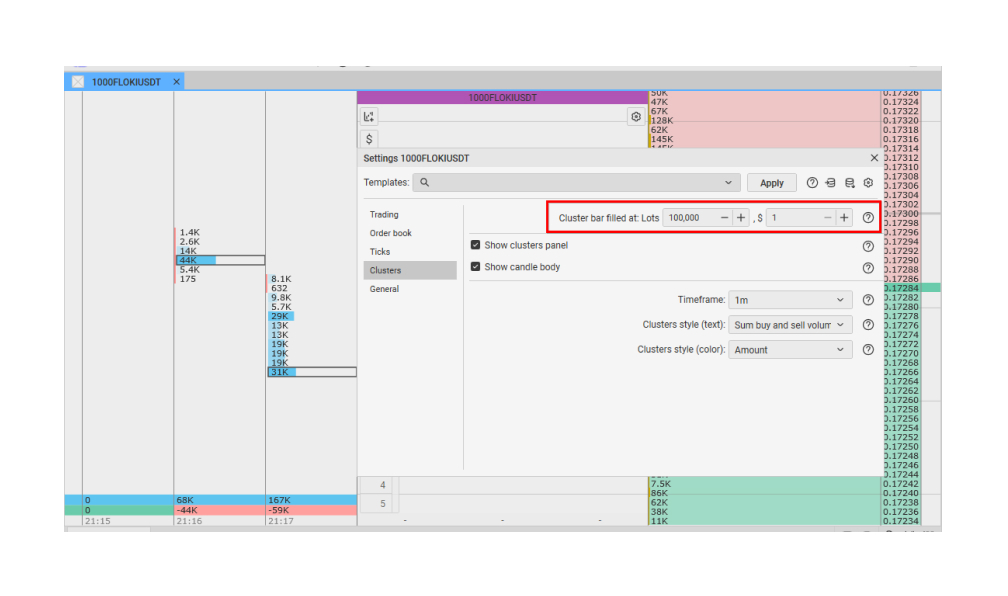
“Cluster bar filled at” setting
If you set the value to 10,000,000, the full scale at each price will correspond to 10,000,000 lots. For example, if 50,000,000 lots have been traded, the bar will be half-filled; if 75,000,000, the bar will be three-quarters filled, and so on. The traded volume numbers remain unchanged – only the histogram display is affected.
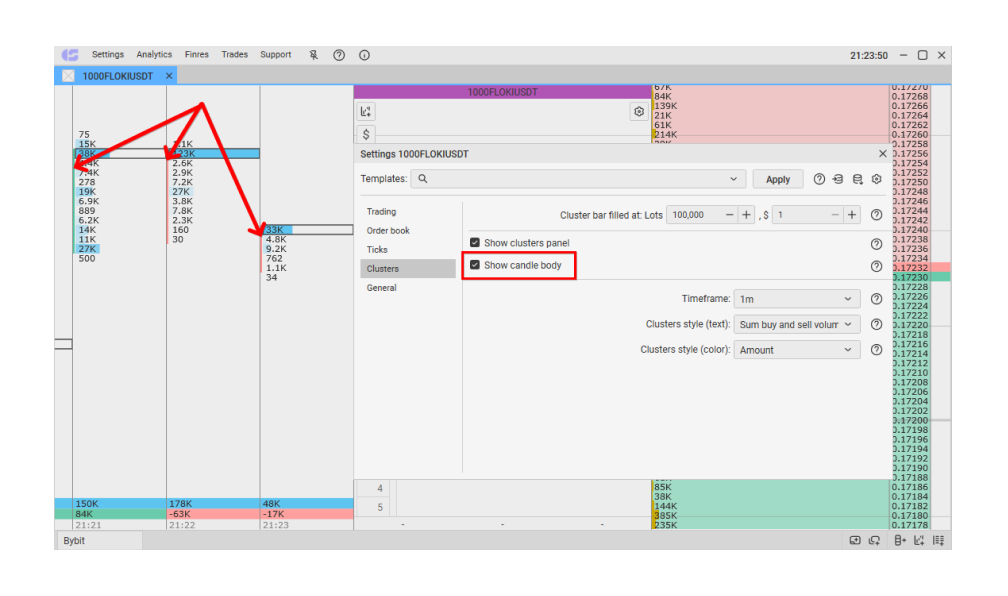
Show Candle Body CScalp setting
The “Show Candle Body” parameter colors the candle body next to the clusters for each timeframe.
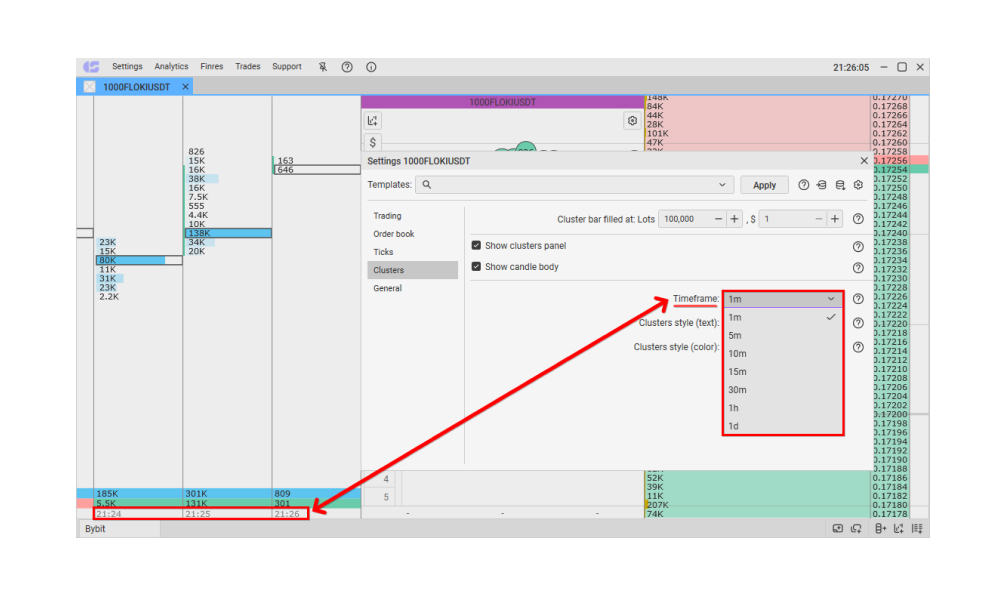
Timeframe cluster setting in the CScalp terminal
The “Timeframe” setting determines the timeframe for the clusters. With a value of 1m, each column corresponds to a one-minute candle; with 1H, a one-hour candle, etc. Timeframes can also be changed by right-clicking on the clusters.
The last setting – Cluster Style (text) – sets the display style for purchases and sales at each price level within the clusters. Let’s look at each setting separately:
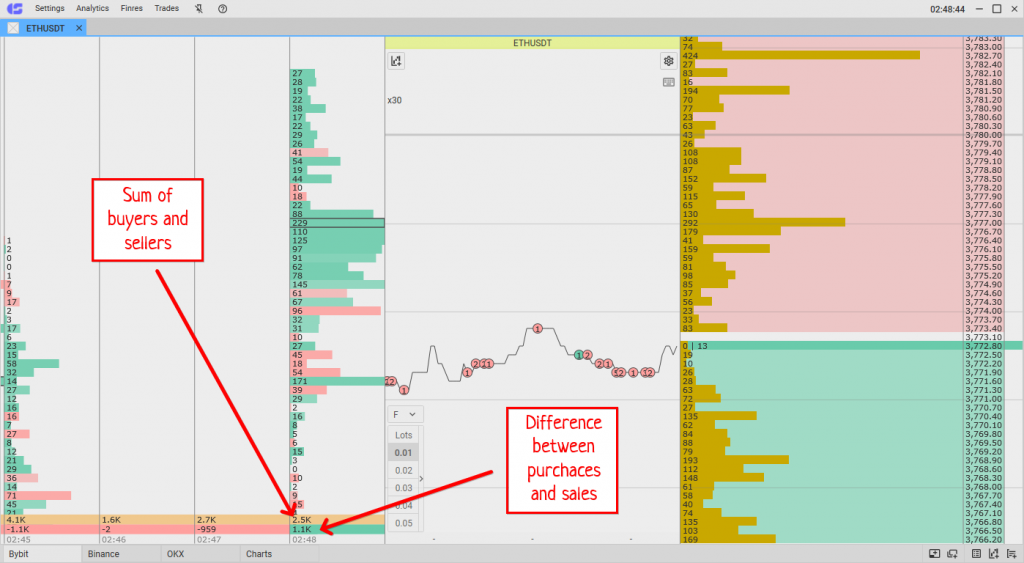
- Sum buy and sell volume: The total volume traded at each level within the candle. For example, if 10 lots were bought and 5 sold at a certain level, the row will indicate 15.
- Difference of buy and sell volume: The same delta, but for individual price levels within the candle. If 30 lots were sold and 10 were bought at a certain price, the delta at that price will show -20.
- “Bought x Sold”: This parameter separates the volumes of purchases from sales volumes and displays them as separate numbers. The first number is sales, the second is purchases.
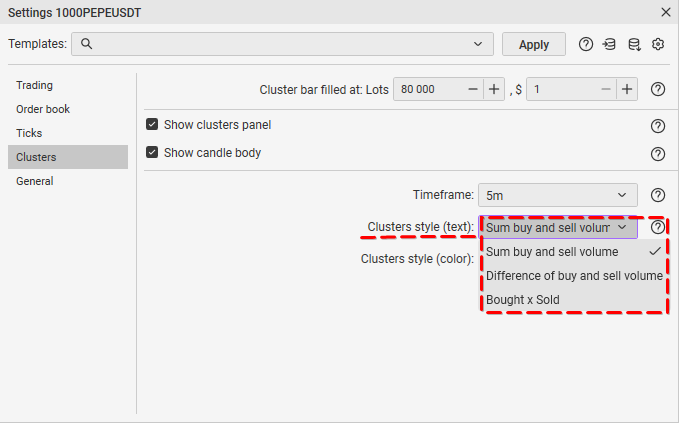
CScalp clusters setting
This parameter allows for identifying the dominance of sellers and buyers at specific price levels within the candle.
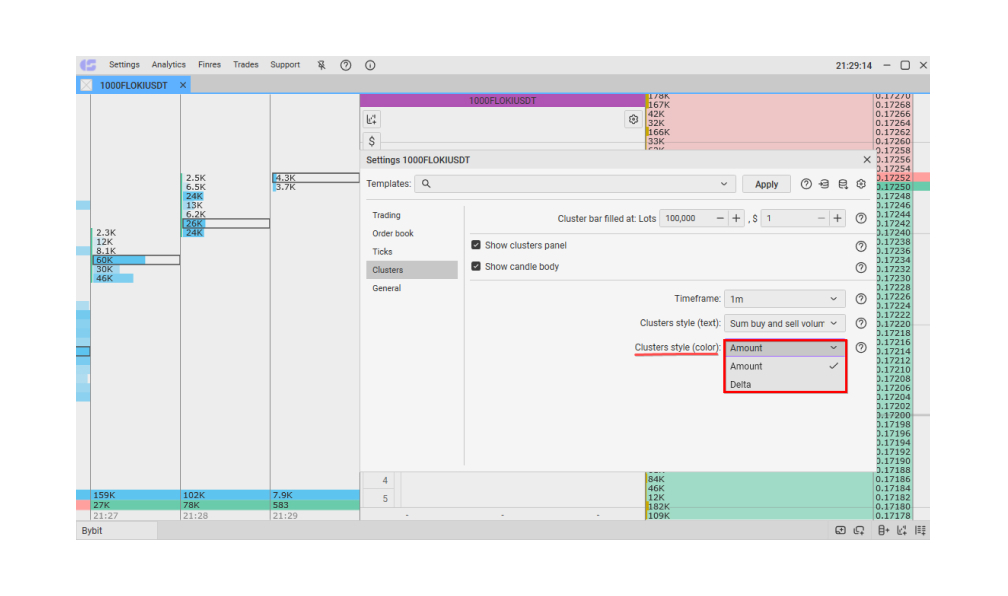
Cluster Style (Color) Parameter
The “Cluster Style (Color)” parameter changes the color filling of the clusters.
- “Delta” fills the clusters with green or red color, depending on the predominance of buys or sells.
- “Amount” fills the clusters with blue color, depending on the total volume of buys and sells.
Join the CScalp Trading Community
Join our official trader's chat. Here you can communicate with other scalpers, find trading soulmates and discuss the market. We also have an exclusive chat for crypto traders!
Don't forget to subscribe to our official CScalp news channel, use trading signals and get to know our bot.
If you have any questions, just contact our platform's support via Telegram at @CScalp_support_bot. We will respond in a matter of seconds.
You can also visit our Discord channel and subscribe to the CScalp TV YouTube channel.
JOIN OUR CHAT